
|
Hangzhou Binjiang Real Estate Group Co., Ltd (002244.SZ) Valation DCF |
Entièrement Modifiable: Adapté À Vos Besoins Dans Excel Ou Sheets
Conception Professionnelle: Modèles Fiables Et Conformes Aux Normes Du Secteur
Pré-Construits Pour Une Utilisation Rapide Et Efficace
Compatible MAC/PC, entièrement débloqué
Aucune Expertise N'Est Requise; Facile À Suivre
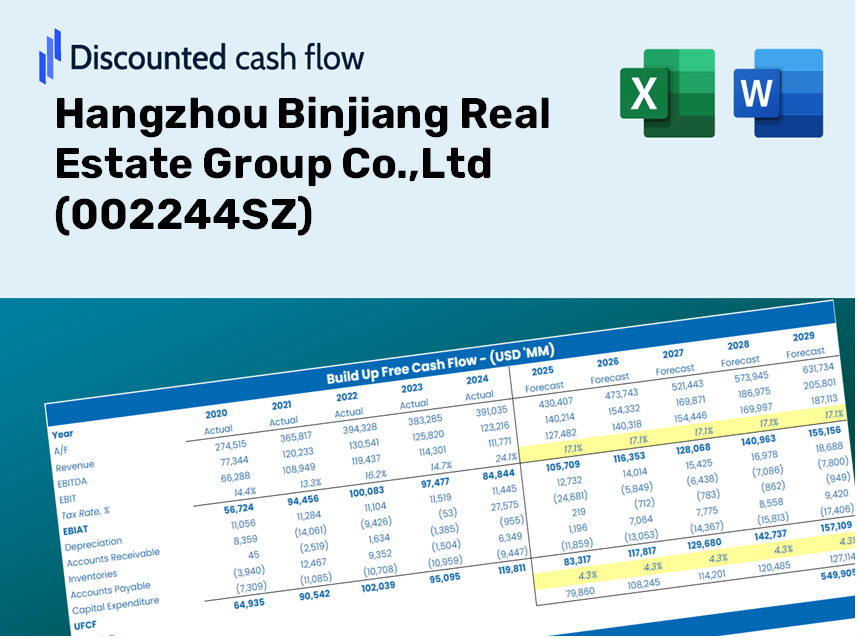
Hangzhou Binjiang Real Estate Group Co.,Ltd (002244.SZ) Bundle
Améliorez votre stratégie d'investissement avec la calculatrice DCF (002244SZ)! Utilisez des données financières authentiques de Hangzhou Binjiang Real Estate Group Co., Ltd, ajustez les projections et dépenses de croissance et observez instantanément comment ces modifications affectent la valeur intrinsèque de l'entreprise.
Discounted Cash Flow (DCF) - (USD MM)
| Year | AY1 2020 |
AY2 2021 |
AY3 2022 |
AY4 2023 |
AY5 2024 |
FY1 2025 |
FY2 2026 |
FY3 2027 |
FY4 2028 |
FY5 2029 |
|---|---|---|---|---|---|---|---|---|---|---|
| Revenue | 28,596.8 | 37,976.4 | 41,502.3 | 70,442.6 | 69,151.8 | 88,165.7 | 112,407.6 | 143,314.9 | 182,720.5 | 232,961.1 |
| Revenue Growth, % | 0 | 32.8 | 9.28 | 69.73 | -1.83 | 27.5 | 27.5 | 27.5 | 27.5 | 27.5 |
| EBITDA | 5,895.2 | 7,640.2 | 6,814.2 | 5,273.9 | 7,265.0 | 13,250.4 | 16,893.7 | 21,538.8 | 27,461.1 | 35,011.7 |
| EBITDA, % | 20.61 | 20.12 | 16.42 | 7.49 | 10.51 | 15.03 | 15.03 | 15.03 | 15.03 | 15.03 |
| Depreciation | 196.9 | 356.7 | 426.8 | 505.8 | 635.3 | 757.0 | 965.1 | 1,230.5 | 1,568.8 | 2,000.2 |
| Depreciation, % | 0.68857 | 0.93923 | 1.03 | 0.71797 | 0.91876 | 0.85858 | 0.85858 | 0.85858 | 0.85858 | 0.85858 |
| EBIT | 5,698.3 | 7,283.6 | 6,387.4 | 4,768.2 | 6,629.7 | 12,493.4 | 15,928.6 | 20,308.3 | 25,892.3 | 33,011.6 |
| EBIT, % | 19.93 | 19.18 | 15.39 | 6.77 | 9.59 | 14.17 | 14.17 | 14.17 | 14.17 | 14.17 |
| Total Cash | 18,527.4 | 21,152.2 | 24,411.2 | 32,819.9 | 37,280.7 | 49,338.9 | 62,905.1 | 80,201.3 | 102,253.3 | 130,368.7 |
| Total Cash, percent | .0 | .0 | .0 | .0 | .0 | .0 | .0 | .0 | .0 | .0 |
| Account Receivables | 16,232.0 | 18,263.1 | 30,802.9 | 38,586.5 | 28,424.5 | 48,483.0 | 61,813.8 | 78,810.1 | 100,479.5 | 128,107.2 |
| Account Receivables, % | 56.76 | 48.09 | 74.22 | 54.78 | 41.1 | 54.99 | 54.99 | 54.99 | 54.99 | 54.99 |
| Inventories | 116,261.7 | 142,401.4 | 184,409.2 | 172,697.5 | 148,516.6 | 88,165.7 | 112,407.6 | 143,314.9 | 182,720.5 | 232,961.1 |
| Inventories, % | 406.56 | 374.97 | 444.33 | 245.16 | 214.77 | 100 | 100 | 100 | 100 | 100 |
| Accounts Payable | 4,204.5 | 3,410.7 | 3,699.1 | 5,557.6 | 5,640.8 | 8,577.4 | 10,935.8 | 13,942.7 | 17,776.3 | 22,664.1 |
| Accounts Payable, % | 14.7 | 8.98 | 8.91 | 7.89 | 8.16 | 9.73 | 9.73 | 9.73 | 9.73 | 9.73 |
| Capital Expenditure | -80.2 | -42.1 | -137.0 | -188.8 | -27.8 | -181.6 | -231.5 | -295.2 | -376.4 | -479.8 |
| Capital Expenditure, % | -0.2806 | -0.11099 | -0.33003 | -0.26805 | -0.04018694 | -0.20597 | -0.20597 | -0.20597 | -0.20597 | -0.20597 |
| Tax Rate, % | 57.1 | 57.1 | 57.1 | 57.1 | 57.1 | 57.1 | 57.1 | 57.1 | 57.1 | 57.1 |
| EBITAT | 4,223.0 | 5,319.9 | 4,500.5 | 2,394.8 | 2,844.0 | 7,764.2 | 9,899.1 | 12,620.9 | 16,091.1 | 20,515.5 |
| Depreciation | ||||||||||
| Changes in Account Receivables | ||||||||||
| Changes in Inventories | ||||||||||
| Changes in Accounts Payable | ||||||||||
| Capital Expenditure | ||||||||||
| UFCF | -123,949.7 | -23,330.0 | -49,468.9 | 8,498.3 | 37,877.8 | 51,568.5 | -24,581.6 | -31,340.5 | -39,957.9 | -50,944.6 |
| WACC, % | 4.9 | 4.89 | 4.85 | 4.53 | 4.42 | 4.72 | 4.72 | 4.72 | 4.72 | 4.72 |
| PV UFCF | ||||||||||
| SUM PV UFCF | -74,152.5 | |||||||||
| Long Term Growth Rate, % | 2.00 | |||||||||
| Free cash flow (T + 1) | -51,964 | |||||||||
| Terminal Value | -1,912,342 | |||||||||
| Present Terminal Value | -1,518,707 | |||||||||
| Enterprise Value | -1,592,859 | |||||||||
| Net Debt | -9,470 | |||||||||
| Equity Value | -1,583,389 | |||||||||
| Diluted Shares Outstanding, MM | 3,105 | |||||||||
| Equity Value Per Share | -510.02 |
What You Will Receive
- Accurate 002244 Financial Data: Pre-loaded with Hangzhou Binjiang Real Estate Group Co.,Ltd’s historical and projected figures for thorough analysis.
- Customizable Template: Easily adjust essential inputs such as revenue growth, WACC, and EBITDA margin.
- Instant Calculations: Watch the intrinsic value of Hangzhou Binjiang Real Estate Group Co.,Ltd update in real-time as you make changes.
- Professional Valuation Tool: Tailored for investors, analysts, and consultants seeking reliable DCF outcomes.
- Intuitive Interface: Designed with a straightforward layout and clear instructions to accommodate all levels of expertise.
Key Features
- Comprehensive DCF Calculator: Offers detailed unlevered and levered DCF valuation models tailored for Hangzhou Binjiang Real Estate Group Co., Ltd (002244SZ).
- WACC Calculator: Comes with a pre-configured Weighted Average Cost of Capital tool featuring adjustable inputs.
- Customizable Forecast Assumptions: Easily adjust growth rates, capital expenditures, and discount rates to suit your analysis.
- Integrated Financial Ratios: Evaluate profitability, leverage, and efficiency ratios specific to Hangzhou Binjiang Real Estate Group Co., Ltd (002244SZ).
- Interactive Dashboard and Charts: Visual representations that provide a summary of essential valuation metrics for streamlined analysis.
How It Works
- Step 1: Download the Excel file.
- Step 2: Examine the pre-filled data for Hangzhou Binjiang Real Estate Group Co., Ltd (002244SZ).
- Step 3: Modify key assumptions (highlighted in yellow) according to your insights.
- Step 4: Observe the automatic recalculations reflecting the intrinsic value of Hangzhou Binjiang Real Estate Group Co., Ltd (002244SZ).
- Step 5: Utilize the results for making investment decisions or for reporting purposes.
Why Select This Calculator for Hangzhou Binjiang Real Estate Group Co., Ltd (002244SZ)?
- All-in-One Tool: Combines DCF, WACC, and comprehensive financial ratio analyses in a single platform.
- Flexible Inputs: Modify the highlighted input fields to explore different scenarios tailored to your needs.
- In-Depth Analysis: Automatically computes the intrinsic value and Net Present Value for Hangzhou Binjiang Real Estate Group.
- Preloaded Information: Features historical and projected data to provide reliable starting points for analysis.
- High-Quality Standards: Perfect for financial analysts, investors, and business consultants focused on real estate.
Who Can Benefit from This Product?
- Real Estate Students: Explore valuation methods and practice with actual market data.
- Researchers: Integrate advanced models into your academic projects or studies.
- Property Investors: Validate your investment strategies and assess valuation scenarios for Hangzhou Binjiang Real Estate Group Co., Ltd (002244SZ).
- Market Analysts: Enhance your efficiency with a customizable, ready-to-use DCF model.
- Property Developers: Understand how major real estate firms like Hangzhou Binjiang are evaluated in the market.
Contents of the Template
- Operating and Balance Sheet Data: Pre-filled historical data and forecasts for Hangzhou Binjiang Real Estate Group Co., Ltd (002244SZ), including revenue, EBITDA, EBIT, and capital expenditures.
- WACC Calculation: A dedicated sheet for the Weighted Average Cost of Capital (WACC), featuring essential parameters such as Beta, risk-free rate, and share price.
- DCF Valuation (Unlevered and Levered): Customizable Discounted Cash Flow models that illustrate intrinsic value along with comprehensive calculations.
- Financial Statements: Preloaded financial statements (annual and quarterly) to facilitate in-depth analysis.
- Key Ratios: Contains profitability, leverage, and efficiency ratios relevant to Hangzhou Binjiang Real Estate Group Co., Ltd (002244SZ).
- Dashboard and Charts: A visual overview of valuation outputs and assumptions for easy analysis of results.
Disclaimer
All information, articles, and product details provided on this website are for general informational and educational purposes only. We do not claim any ownership over, nor do we intend to infringe upon, any trademarks, copyrights, logos, brand names, or other intellectual property mentioned or depicted on this site. Such intellectual property remains the property of its respective owners, and any references here are made solely for identification or informational purposes, without implying any affiliation, endorsement, or partnership.
We make no representations or warranties, express or implied, regarding the accuracy, completeness, or suitability of any content or products presented. Nothing on this website should be construed as legal, tax, investment, financial, medical, or other professional advice. In addition, no part of this site—including articles or product references—constitutes a solicitation, recommendation, endorsement, advertisement, or offer to buy or sell any securities, franchises, or other financial instruments, particularly in jurisdictions where such activity would be unlawful.
All content is of a general nature and may not address the specific circumstances of any individual or entity. It is not a substitute for professional advice or services. Any actions you take based on the information provided here are strictly at your own risk. You accept full responsibility for any decisions or outcomes arising from your use of this website and agree to release us from any liability in connection with your use of, or reliance upon, the content or products found herein.