
|
North Chemical Industries Co., Ltd. (002246.SZ) Évaluation DCF |
Entièrement Modifiable: Adapté À Vos Besoins Dans Excel Ou Sheets
Conception Professionnelle: Modèles Fiables Et Conformes Aux Normes Du Secteur
Pré-Construits Pour Une Utilisation Rapide Et Efficace
Compatible MAC/PC, entièrement débloqué
Aucune Expertise N'Est Requise; Facile À Suivre
North Chemical Industries Co., Ltd. (002246.SZ) Bundle
Améliorez votre stratégie d'investissement avec la calculatrice DCF (002246SZ) de North Chemical Industries Co., Ltd.! Explorez les finances authentiques, ajustez les prédictions et les dépenses de croissance et observez instantanément comment ces modifications affectent la valeur intrinsèque de (002246SZ).
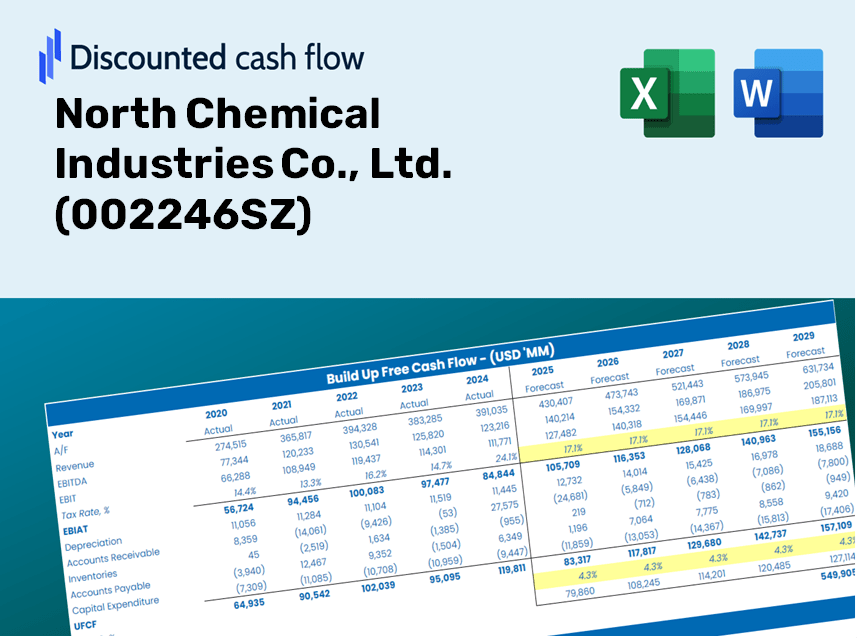
Discounted Cash Flow (DCF) - (USD MM)
| Year | AY1 2020 |
AY2 2021 |
AY3 2022 |
AY4 2023 |
AY5 2024 |
FY1 2025 |
FY2 2026 |
FY3 2027 |
FY4 2028 |
FY5 2029 |
|---|---|---|---|---|---|---|---|---|---|---|
| Revenue | 2,358.6 | 2,633.5 | 2,558.7 | 2,159.2 | 1,947.0 | 1,866.1 | 1,788.6 | 1,714.2 | 1,643.0 | 1,574.7 |
| Revenue Growth, % | 0 | 11.66 | -2.84 | -15.61 | -9.83 | -4.16 | -4.16 | -4.16 | -4.16 | -4.16 |
| EBITDA | 152.5 | 183.6 | 121.4 | 92.9 | 3.9 | 84.7 | 81.2 | 77.8 | 74.6 | 71.5 |
| EBITDA, % | 6.47 | 6.97 | 4.75 | 4.3 | 0.20245 | 4.54 | 4.54 | 4.54 | 4.54 | 4.54 |
| Depreciation | 95.3 | 97.3 | 93.5 | 105.2 | 112.3 | 82.2 | 78.8 | 75.5 | 72.4 | 69.4 |
| Depreciation, % | 4.04 | 3.69 | 3.66 | 4.87 | 5.77 | 4.41 | 4.41 | 4.41 | 4.41 | 4.41 |
| EBIT | 57.2 | 86.3 | 27.9 | -12.3 | -108.3 | 2.4 | 2.3 | 2.2 | 2.2 | 2.1 |
| EBIT, % | 2.42 | 3.28 | 1.09 | -0.57041 | -5.56 | 0.13116 | 0.13116 | 0.13116 | 0.13116 | 0.13116 |
| Total Cash | 1,644.3 | 1,748.7 | 1,758.3 | 1,608.8 | 1,629.2 | 1,354.9 | 1,298.6 | 1,244.6 | 1,192.9 | 1,143.3 |
| Total Cash, percent | .0 | .0 | .0 | .0 | .0 | .0 | .0 | .0 | .0 | .0 |
| Account Receivables | 654.6 | 738.7 | 943.3 | 1,035.5 | 1,141.2 | 743.6 | 712.7 | 683.1 | 654.7 | 627.5 |
| Account Receivables, % | 27.75 | 28.05 | 36.87 | 47.96 | 58.61 | 39.85 | 39.85 | 39.85 | 39.85 | 39.85 |
| Inventories | 491.6 | 494.0 | 428.0 | 433.4 | 353.9 | 353.0 | 338.3 | 324.3 | 310.8 | 297.9 |
| Inventories, % | 20.84 | 18.76 | 16.73 | 20.07 | 18.18 | 18.92 | 18.92 | 18.92 | 18.92 | 18.92 |
| Accounts Payable | 708.5 | 823.2 | 995.7 | 845.0 | 987.2 | 709.3 | 679.8 | 651.6 | 624.5 | 598.5 |
| Accounts Payable, % | 30.04 | 31.26 | 38.91 | 39.13 | 50.7 | 38.01 | 38.01 | 38.01 | 38.01 | 38.01 |
| Capital Expenditure | -85.2 | -172.5 | -136.9 | -47.3 | -58.0 | -77.2 | -74.0 | -70.9 | -68.0 | -65.1 |
| Capital Expenditure, % | -3.61 | -6.55 | -5.35 | -2.19 | -2.98 | -4.14 | -4.14 | -4.14 | -4.14 | -4.14 |
| Tax Rate, % | 15.67 | 15.67 | 15.67 | 15.67 | 15.67 | 15.67 | 15.67 | 15.67 | 15.67 | 15.67 |
| EBITAT | 53.0 | 97.4 | 27.3 | -14.0 | -91.4 | 2.3 | 2.2 | 2.1 | 2.0 | 2.0 |
| Depreciation | ||||||||||
| Changes in Account Receivables | ||||||||||
| Changes in Inventories | ||||||||||
| Changes in Accounts Payable | ||||||||||
| Capital Expenditure | ||||||||||
| UFCF | -374.5 | 50.2 | 18.0 | -204.4 | 78.9 | 128.0 | 23.2 | 22.2 | 21.3 | 20.4 |
| WACC, % | 7.49 | 7.49 | 7.49 | 7.49 | 7.48 | 7.49 | 7.49 | 7.49 | 7.49 | 7.49 |
| PV UFCF | ||||||||||
| SUM PV UFCF | 187.1 | |||||||||
| Long Term Growth Rate, % | 2.00 | |||||||||
| Free cash flow (T + 1) | 21 | |||||||||
| Terminal Value | 379 | |||||||||
| Present Terminal Value | 264 | |||||||||
| Enterprise Value | 451 | |||||||||
| Net Debt | -1,315 | |||||||||
| Equity Value | 1,766 | |||||||||
| Diluted Shares Outstanding, MM | 566 | |||||||||
| Equity Value Per Share | 3.12 |
What You Will Receive
- Comprehensive Financial Model: Leverage North Chemical Industries Co., Ltd.'s actual data for accurate DCF valuation.
- Complete Forecast Control: Modify revenue growth, profit margins, WACC, and other critical factors.
- Real-Time Calculations: Instant updates allow you to view results dynamically as you adjust inputs.
- Professional-Grade Template: A polished Excel file crafted for high-quality valuation presentations.
- Flexible and Reusable: Designed for adaptability, enabling detailed forecasts for repeated use.
Core Features of North Chemical Industries Co., Ltd. (002246SZ)
- Accurate Financial Data: Gain access to reliable historical figures and future forecasts.
- Adjustable Forecast Variables: Modify highlighted fields such as WACC, growth rates, and profit margins.
- Real-Time Calculations: Automatic updates for DCF, Net Present Value (NPV), and cash flow assessments.
- User-Friendly Dashboard: Intuitive charts and summaries for visualizing your valuation insights.
- Suitable for All Skill Levels: Designed with simplicity in mind for investors, CFOs, and consultants alike.
How It Functions
- Download: Obtain the pre-configured Excel spreadsheet containing North Chemical Industries Co., Ltd.'s (002246SZ) financial data.
- Customize: Modify forecasts, such as revenue growth, EBITDA %, and WACC as per your analysis.
- Update Automatically: Watch the intrinsic value and NPV calculations refresh in real-time.
- Test Scenarios: Generate multiple projections and evaluate outcomes simultaneously.
- Make Decisions: Leverage the valuation results to inform your investment approach.
Why Opt for This Calculator?
- Designed for Industry Experts: A sophisticated tool tailored for analysts, CFOs, and consultants.
- Accurate Financial Data: North Chemical Industries Co., Ltd.’s historical and projected financials are preloaded for precision.
- Flexible Scenario Analysis: Effortlessly simulate various forecasts and assumptions.
- Intuitive Outputs: Automatically calculates intrinsic value, NPV, and essential metrics.
- User-Friendly Experience: Step-by-step guidance makes the process simple and straightforward.
Who Can Benefit from Our Products?
- Industry Professionals: Develop comprehensive and accurate valuation models for assessing investment opportunities in North Chemical Industries Co., Ltd. (002246SZ).
- Corporate Finance Teams: Evaluate various valuation scenarios to inform strategic decisions within your organization.
- Consultants and Advisors: Equip clients with precise valuation insights for North Chemical Industries Co., Ltd. (002246SZ).
- Students and Educators: Leverage real-world data to enhance financial modeling skills and teaching methodologies.
- Chemical Industry Enthusiasts: Gain insights into how companies like North Chemical Industries Co., Ltd. (002246SZ) are valued within the marketplace.
Contents of the Template
- Comprehensive DCF Model: An editable template featuring in-depth valuation calculations.
- Real-World Data: North Chemical Industries Co., Ltd.'s (002246SZ) historical and projected financials included for analysis.
- Customizable Parameters: Modify WACC, growth rates, and tax assumptions to explore different scenarios.
- Financial Statements: Detailed annual and quarterly breakdowns for enhanced analysis.
- Key Ratios: Integrated analysis of profitability, efficiency, and leverage metrics.
- Dashboard with Visual Outputs: Visual aids including charts and tables to present clear, actionable insights.
Disclaimer
All information, articles, and product details provided on this website are for general informational and educational purposes only. We do not claim any ownership over, nor do we intend to infringe upon, any trademarks, copyrights, logos, brand names, or other intellectual property mentioned or depicted on this site. Such intellectual property remains the property of its respective owners, and any references here are made solely for identification or informational purposes, without implying any affiliation, endorsement, or partnership.
We make no representations or warranties, express or implied, regarding the accuracy, completeness, or suitability of any content or products presented. Nothing on this website should be construed as legal, tax, investment, financial, medical, or other professional advice. In addition, no part of this site—including articles or product references—constitutes a solicitation, recommendation, endorsement, advertisement, or offer to buy or sell any securities, franchises, or other financial instruments, particularly in jurisdictions where such activity would be unlawful.
All content is of a general nature and may not address the specific circumstances of any individual or entity. It is not a substitute for professional advice or services. Any actions you take based on the information provided here are strictly at your own risk. You accept full responsibility for any decisions or outcomes arising from your use of this website and agree to release us from any liability in connection with your use of, or reliance upon, the content or products found herein.