
|
Shenzhen WorldUnion Group Incorporated (002285.SZ) Évaluation DCF |
Entièrement Modifiable: Adapté À Vos Besoins Dans Excel Ou Sheets
Conception Professionnelle: Modèles Fiables Et Conformes Aux Normes Du Secteur
Pré-Construits Pour Une Utilisation Rapide Et Efficace
Compatible MAC/PC, entièrement débloqué
Aucune Expertise N'Est Requise; Facile À Suivre
Shenzhen Worldunion Group Incorporated (002285.SZ) Bundle
Gardez un aperçu de votre analyse d'évaluation Shenzhen WorldUnion Group Incorporated (002285SZ) avec notre calculatrice DCF de pointe! Équipé de données réelles (002285SZ), ce modèle Excel vous permet d'ajuster les prévisions et les hypothèses pour déterminer avec précision la valeur intrinsèque du groupe Shenzhen WorldUnion Incorporated.
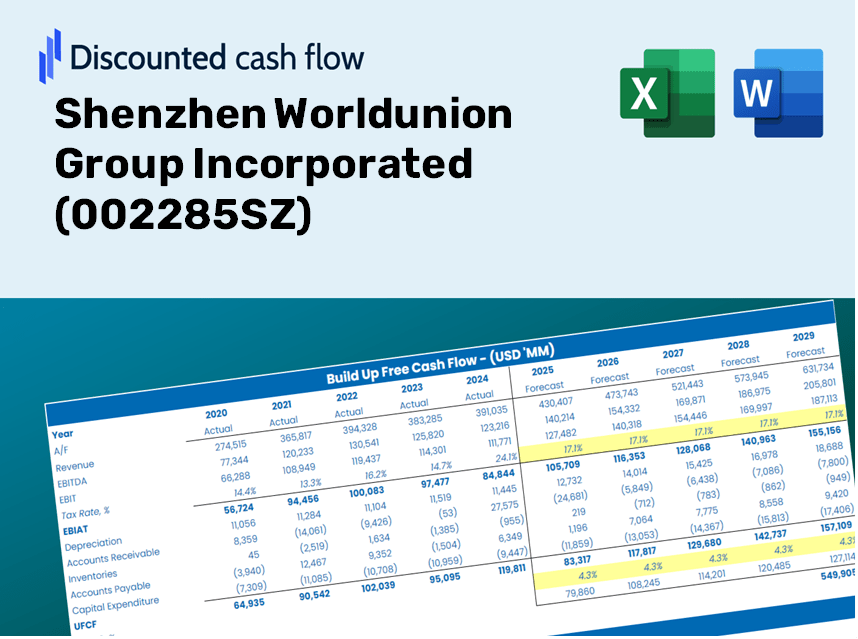
Discounted Cash Flow (DCF) - (USD MM)
| Year | AY1 2020 |
AY2 2021 |
AY3 2022 |
AY4 2023 |
AY5 2024 |
FY1 2025 |
FY2 2026 |
FY3 2027 |
FY4 2028 |
FY5 2029 |
|---|---|---|---|---|---|---|---|---|---|---|
| Revenue | 6,722.7 | 6,082.5 | 3,979.4 | 3,373.3 | 2,444.6 | 1,913.7 | 1,498.2 | 1,172.8 | 918.1 | 718.8 |
| Revenue Growth, % | 0 | -9.52 | -34.58 | -15.23 | -27.53 | -21.72 | -21.72 | -21.72 | -21.72 | -21.72 |
| EBITDA | 851.4 | -578.1 | 46.2 | -129.5 | -40.6 | -4.5 | -3.5 | -2.8 | -2.2 | -1.7 |
| EBITDA, % | 12.66 | -9.5 | 1.16 | -3.84 | -1.66 | -0.2355 | -0.2355 | -0.2355 | -0.2355 | -0.2355 |
| Depreciation | 361.8 | 397.9 | 239.1 | 117.9 | 52.2 | 90.2 | 70.6 | 55.3 | 43.3 | 33.9 |
| Depreciation, % | 5.38 | 6.54 | 6.01 | 3.5 | 2.13 | 4.71 | 4.71 | 4.71 | 4.71 | 4.71 |
| EBIT | 489.6 | -976.0 | -192.9 | -247.4 | -92.7 | -94.7 | -74.1 | -58.0 | -45.4 | -35.6 |
| EBIT, % | 7.28 | -16.05 | -4.85 | -7.33 | -3.79 | -4.95 | -4.95 | -4.95 | -4.95 | -4.95 |
| Total Cash | 2,263.5 | 1,866.3 | 2,200.8 | 1,614.2 | 1,204.3 | 829.7 | 649.5 | 508.5 | 398.1 | 311.6 |
| Total Cash, percent | .0 | .0 | .0 | .0 | .0 | .0 | .0 | .0 | .0 | .0 |
| Account Receivables | 2,326.1 | 1,617.7 | 1,936.3 | 1,411.6 | 1,114.7 | 755.2 | 591.2 | 462.8 | 362.3 | 283.6 |
| Account Receivables, % | 34.6 | 26.6 | 48.66 | 41.85 | 45.6 | 39.46 | 39.46 | 39.46 | 39.46 | 39.46 |
| Inventories | 44.8 | 81.3 | 14.3 | 18.7 | 21.6 | 14.5 | 11.4 | 8.9 | 7.0 | 5.5 |
| Inventories, % | 0.6664 | 1.34 | 0.35979 | 0.55292 | 0.88371 | 0.75979 | 0.75979 | 0.75979 | 0.75979 | 0.75979 |
| Accounts Payable | 275.6 | 523.0 | 508.6 | 426.0 | 403.2 | 209.0 | 163.6 | 128.1 | 100.3 | 78.5 |
| Accounts Payable, % | 4.1 | 8.6 | 12.78 | 12.63 | 16.5 | 10.92 | 10.92 | 10.92 | 10.92 | 10.92 |
| Capital Expenditure | -90.8 | -30.4 | -50.2 | -5.3 | -4.5 | -13.2 | -10.3 | -8.1 | -6.3 | -5.0 |
| Capital Expenditure, % | -1.35 | -0.50032 | -1.26 | -0.15672 | -0.18324 | -0.69053 | -0.69053 | -0.69053 | -0.69053 | -0.69053 |
| Tax Rate, % | -110.24 | -110.24 | -110.24 | -110.24 | -110.24 | -110.24 | -110.24 | -110.24 | -110.24 | -110.24 |
| EBITAT | 169.5 | -960.5 | -239.3 | -263.9 | -194.9 | -82.0 | -64.2 | -50.3 | -39.3 | -30.8 |
| Depreciation | ||||||||||
| Changes in Account Receivables | ||||||||||
| Changes in Inventories | ||||||||||
| Changes in Accounts Payable | ||||||||||
| Capital Expenditure | ||||||||||
| UFCF | -1,654.8 | 326.3 | -316.5 | 286.5 | 124.0 | 167.3 | 117.8 | 92.2 | 72.2 | 56.5 |
| WACC, % | 9.36 | 9.46 | 9.46 | 9.46 | 9.46 | 9.44 | 9.44 | 9.44 | 9.44 | 9.44 |
| PV UFCF | ||||||||||
| SUM PV UFCF | 407.9 | |||||||||
| Long Term Growth Rate, % | 3.50 | |||||||||
| Free cash flow (T + 1) | 59 | |||||||||
| Terminal Value | 985 | |||||||||
| Present Terminal Value | 627 | |||||||||
| Enterprise Value | 1,035 | |||||||||
| Net Debt | -1,134 | |||||||||
| Equity Value | 2,170 | |||||||||
| Diluted Shares Outstanding, MM | 1,993 | |||||||||
| Equity Value Per Share | 1.09 |
What You Will Receive
- Genuine Shenzhen Worldunion Data: Comprehensive financials – ranging from revenue to EBIT – based on actual and projected values.
- Complete Customization: Modify all essential parameters (yellow cells) such as WACC, growth %, and tax rates.
- Immediate Valuation Adjustments: Automatic recalculations to assess how changes affect the fair value of Shenzhen Worldunion Group (002285SZ).
- Flexible Excel Template: Designed for quick modifications, scenario analysis, and thorough projections.
- Efficient and Precise: Avoid the hassle of building models from the ground up while ensuring accuracy and adaptability.
Key Features
- Advanced DCF Calculator: Features comprehensive unlevered and levered DCF valuation models tailored for Shenzhen Worldunion Group Incorporated (002285SZ).
- WACC Calculator: Pre-configured Weighted Average Cost of Capital sheet with adjustable inputs specific to the company.
- Editable Forecast Assumptions: Easily adjust growth rates, capital expenditures, and discount rates for accurate projections.
- Built-In Financial Ratios: Evaluate profitability, leverage, and operational efficiency ratios relevant to Shenzhen Worldunion Group Incorporated (002285SZ).
- Dashboard and Charts: Visual representations that condense key valuation metrics for straightforward analysis.
How It Functions
- Step 1: Download the Excel file.
- Step 2: Examine the pre-filled data for Shenzhen Worldunion Group Incorporated (002285SZ) (Symbol), including both historical and projected figures.
- Step 3: Modify the key assumptions (highlighted in yellow) according to your analysis.
- Step 4: Observe the automatic recalculations to determine the intrinsic value of Shenzhen Worldunion Group Incorporated (002285SZ) (Symbol).
- Step 5: Utilize the results for your investment strategies or reporting purposes.
Why Opt for This Calculator?
- Precision: Utilizes authentic Shenzhen Worldunion Group financials for reliable data.
- Versatility: Tailored for users to easily experiment and adjust inputs to their preference.
- Efficiency: Eliminate the tediousness of constructing a DCF model from the ground up.
- High-Quality Standards: Crafted with the accuracy and usability expected at a CFO level.
- Accessible: Intuitive design makes it straightforward for users with minimal financial modeling skills.
Who Can Benefit from This Product?
- Investors: Effectively assess the fair value of Shenzhen Worldunion Group Incorporated (002285SZ) prior to making investment choices.
- CFOs: Utilize a top-tier DCF model for enhanced financial reporting and analysis.
- Consultants: Seamlessly customize the template for client valuation reports.
- Entrepreneurs: Discover financial modeling techniques employed by leading companies.
- Educators: Implement it as a resource to teach valuation methods in the classroom.
Contents of the Template
- Comprehensive DCF Model: Editable template featuring thorough valuation calculations.
- Real-World Data: Shenzhen Worldunion Group Incorporated’s (002285SZ) historical and projected financials preloaded for in-depth analysis.
- Customizable Parameters: Modify WACC, growth rates, and tax assumptions to explore various scenarios.
- Financial Statements: Complete annual and quarterly breakdowns for enhanced insights.
- Key Ratios: Integrated analysis for profitability, efficiency, and financial leverage.
- Dashboard with Visual Outputs: Graphs and tables for clear and actionable results.
Disclaimer
All information, articles, and product details provided on this website are for general informational and educational purposes only. We do not claim any ownership over, nor do we intend to infringe upon, any trademarks, copyrights, logos, brand names, or other intellectual property mentioned or depicted on this site. Such intellectual property remains the property of its respective owners, and any references here are made solely for identification or informational purposes, without implying any affiliation, endorsement, or partnership.
We make no representations or warranties, express or implied, regarding the accuracy, completeness, or suitability of any content or products presented. Nothing on this website should be construed as legal, tax, investment, financial, medical, or other professional advice. In addition, no part of this site—including articles or product references—constitutes a solicitation, recommendation, endorsement, advertisement, or offer to buy or sell any securities, franchises, or other financial instruments, particularly in jurisdictions where such activity would be unlawful.
All content is of a general nature and may not address the specific circumstances of any individual or entity. It is not a substitute for professional advice or services. Any actions you take based on the information provided here are strictly at your own risk. You accept full responsibility for any decisions or outcomes arising from your use of this website and agree to release us from any liability in connection with your use of, or reliance upon, the content or products found herein.