
|
Shenzhen Comix Group Co., Ltd. (002301.SZ) Évaluation DCF |
Entièrement Modifiable: Adapté À Vos Besoins Dans Excel Ou Sheets
Conception Professionnelle: Modèles Fiables Et Conformes Aux Normes Du Secteur
Pré-Construits Pour Une Utilisation Rapide Et Efficace
Compatible MAC/PC, entièrement débloqué
Aucune Expertise N'Est Requise; Facile À Suivre
Shenzhen Comix Group Co., Ltd. (002301.SZ) Bundle
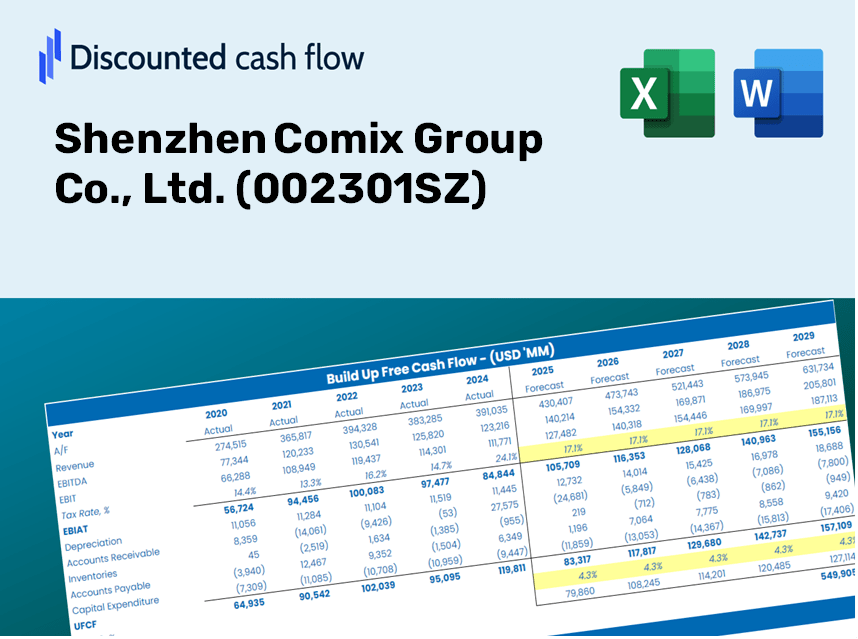
Évaluez les perspectives financières de Shenzhen Comix Group Co., Ltd. (002301SZ) avec des informations expertes! Cette calculatrice DCF (002301SZ) fournit des données financières pré-remplies et la flexibilité pour modifier la croissance des revenus, le WACC, les marges et d'autres hypothèses critiques pour s'aligner sur vos projections.
Discounted Cash Flow (DCF) - (USD MM)
| Year | AY1 2020 |
AY2 2021 |
AY3 2022 |
AY4 2023 |
AY5 2024 |
FY1 2025 |
FY2 2026 |
FY3 2027 |
FY4 2028 |
FY5 2029 |
|---|---|---|---|---|---|---|---|---|---|---|
| Revenue | 8,009.3 | 8,236.3 | 8,629.1 | 11,098.9 | 11,396.9 | 12,230.5 | 13,125.1 | 14,085.2 | 15,115.5 | 16,221.1 |
| Revenue Growth, % | 0 | 2.83 | 4.77 | 28.62 | 2.69 | 7.31 | 7.31 | 7.31 | 7.31 | 7.31 |
| EBITDA | 451.0 | -396.6 | 301.0 | 229.6 | 200.8 | 199.0 | 213.5 | 229.2 | 245.9 | 263.9 |
| EBITDA, % | 5.63 | -4.81 | 3.49 | 2.07 | 1.76 | 1.63 | 1.63 | 1.63 | 1.63 | 1.63 |
| Depreciation | 72.4 | 95.4 | 107.7 | 104.4 | 92.6 | 123.8 | 132.9 | 142.6 | 153.0 | 164.2 |
| Depreciation, % | 0.90368 | 1.16 | 1.25 | 0.94054 | 0.81264 | 1.01 | 1.01 | 1.01 | 1.01 | 1.01 |
| EBIT | 378.6 | -492.0 | 193.4 | 125.2 | 108.2 | 75.2 | 80.7 | 86.6 | 92.9 | 99.7 |
| EBIT, % | 4.73 | -5.97 | 2.24 | 1.13 | 0.94966 | 0.61453 | 0.61453 | 0.61453 | 0.61453 | 0.61453 |
| Total Cash | 3,074.6 | 2,848.9 | 2,797.1 | 3,392.0 | 3,463.7 | 4,069.0 | 4,366.6 | 4,686.0 | 5,028.8 | 5,396.6 |
| Total Cash, percent | .0 | .0 | .0 | .0 | .0 | .0 | .0 | .0 | .0 | .0 |
| Account Receivables | 3,635.4 | 4,068.5 | 2,989.3 | 3,276.8 | 3,074.1 | 4,547.9 | 4,880.6 | 5,237.6 | 5,620.7 | 6,031.8 |
| Account Receivables, % | 45.39 | 49.4 | 34.64 | 29.52 | 26.97 | 37.18 | 37.18 | 37.18 | 37.18 | 37.18 |
| Inventories | 271.0 | 306.4 | 261.7 | 254.3 | 210.3 | 349.1 | 374.7 | 402.1 | 431.5 | 463.0 |
| Inventories, % | 3.38 | 3.72 | 3.03 | 2.29 | 1.85 | 2.85 | 2.85 | 2.85 | 2.85 | 2.85 |
| Accounts Payable | 3,577.6 | 4,398.2 | 3,824.2 | 4,438.1 | 4,216.5 | 5,366.0 | 5,758.5 | 6,179.8 | 6,631.8 | 7,116.9 |
| Accounts Payable, % | 44.67 | 53.4 | 44.32 | 39.99 | 37 | 43.87 | 43.87 | 43.87 | 43.87 | 43.87 |
| Capital Expenditure | -150.6 | -67.6 | -51.7 | -24.8 | -32.0 | -93.0 | -99.8 | -107.2 | -115.0 | -123.4 |
| Capital Expenditure, % | -1.88 | -0.82032 | -0.59884 | -0.2237 | -0.28108 | -0.76075 | -0.76075 | -0.76075 | -0.76075 | -0.76075 |
| Tax Rate, % | 18.49 | 18.49 | 18.49 | 18.49 | 18.49 | 18.49 | 18.49 | 18.49 | 18.49 | 18.49 |
| EBITAT | 293.4 | -476.7 | 196.7 | 153.2 | 88.2 | 68.5 | 73.5 | 78.9 | 84.7 | 90.9 |
| Depreciation | ||||||||||
| Changes in Account Receivables | ||||||||||
| Changes in Inventories | ||||||||||
| Changes in Accounts Payable | ||||||||||
| Capital Expenditure | ||||||||||
| UFCF | -113.5 | -96.7 | 802.5 | 566.6 | 173.9 | -363.8 | 140.9 | 151.2 | 162.3 | 174.1 |
| WACC, % | 5.18 | 5.35 | 5.37 | 5.37 | 5.21 | 5.3 | 5.3 | 5.3 | 5.3 | 5.3 |
| PV UFCF | ||||||||||
| SUM PV UFCF | 177.5 | |||||||||
| Long Term Growth Rate, % | 3.50 | |||||||||
| Free cash flow (T + 1) | 180 | |||||||||
| Terminal Value | 10,021 | |||||||||
| Present Terminal Value | 7,741 | |||||||||
| Enterprise Value | 7,919 | |||||||||
| Net Debt | -3,064 | |||||||||
| Equity Value | 10,982 | |||||||||
| Diluted Shares Outstanding, MM | 698 | |||||||||
| Equity Value Per Share | 15.73 |
Benefits You Will Receive
- Authentic 002301SZ Financial Data: Pre-loaded with Shenzhen Comix Group's historical and forecasted data for accurate analysis.
- Customizable Template: Easily adjust essential inputs such as revenue growth, WACC, and EBITDA %.
- Instant Calculations: Watch as the intrinsic value of Shenzhen Comix Group updates in real-time based on your adjustments.
- Professional Valuation Tool: Tailored for investors, analysts, and consultants who need precise DCF results.
- User-Friendly Layout: A straightforward structure with clear guidance suitable for all levels of expertise.
Key Features
- Comprehensive DCF Calculator: Offers detailed unlevered and levered DCF valuation models tailored for Shenzhen Comix Group Co., Ltd. (002301SZ).
- WACC Calculator: Features a pre-configured Weighted Average Cost of Capital sheet with adjustable inputs specific to the company.
- Customizable Forecast Assumptions: Easily adjust growth rates, capital expenditures, and discount rates to fit your analysis needs.
- Integrated Financial Ratios: Assess profitability, leverage, and efficiency ratios for Shenzhen Comix Group Co., Ltd. (002301SZ).
- Dashboard and Visualizations: Interactive charts present essential valuation metrics for straightforward analysis.
How It Works
- 1. Access the Template: Download and open the Excel file featuring Shenzhen Comix Group Co., Ltd.'s (002301SZ) preloaded data.
- 2. Modify Assumptions: Adjust key parameters such as growth rates, WACC, and capital expenditures.
- 3. Instant Results: The DCF model automatically calculates intrinsic value and NPV in real-time.
- 4. Explore Scenarios: Evaluate various forecasts to examine different valuation possibilities.
- 5. Present with Confidence: Deliver professional valuation insights to reinforce your decision-making process.
Why Opt for Shenzhen Comix Group Co., Ltd. (002301SZ) Calculator?
- Time-Saving: Skip the hassle of building a DCF model from the ground up – it’s pre-configured for your convenience.
- Enhanced Accuracy: Dependable financial data and formulas minimize valuation errors.
- Completely Customizable: Adjust the model to align with your specific assumptions and forecasts.
- User-Friendly: Intuitive charts and outputs ensure the results are straightforward to analyze.
- Relied Upon by Professionals: Engineered for experts who prioritize both precision and ease of use.
Who Can Benefit from This Product?
- Individual Investors: Gain insights to make well-informed decisions regarding investments in Shenzhen Comix Group Co., Ltd. (002301SZ).
- Financial Analysts: Enhance valuation workflows with comprehensive financial models tailored for Shenzhen Comix Group Co., Ltd. (002301SZ).
- Consultants: Provide clients with accurate and timely valuation analyses related to Shenzhen Comix Group Co., Ltd. (002301SZ).
- Business Owners: Learn how major corporations like Shenzhen Comix Group Co., Ltd. (002301SZ) are valued to inform your own business strategy.
- Finance Students: Acquire practical valuation skills using real data and scenarios from Shenzhen Comix Group Co., Ltd. (002301SZ).
What the Template Includes
- Detailed DCF Model: An editable framework featuring extensive valuation calculations.
- Real-Time Data: Shenzhen Comix Group Co., Ltd.’s (002301SZ) historical and projected financials preloaded for in-depth analysis.
- Adjustable Parameters: Modify WACC, growth rates, and tax assumptions to explore various scenarios.
- Comprehensive Financial Statements: Complete annual and quarterly reports for enhanced understanding.
- Essential Ratios: Integrated analysis focusing on profitability, efficiency, and leverage metrics.
- User-Friendly Dashboard: Visual charts and tables that present clear, actionable insights.
Disclaimer
All information, articles, and product details provided on this website are for general informational and educational purposes only. We do not claim any ownership over, nor do we intend to infringe upon, any trademarks, copyrights, logos, brand names, or other intellectual property mentioned or depicted on this site. Such intellectual property remains the property of its respective owners, and any references here are made solely for identification or informational purposes, without implying any affiliation, endorsement, or partnership.
We make no representations or warranties, express or implied, regarding the accuracy, completeness, or suitability of any content or products presented. Nothing on this website should be construed as legal, tax, investment, financial, medical, or other professional advice. In addition, no part of this site—including articles or product references—constitutes a solicitation, recommendation, endorsement, advertisement, or offer to buy or sell any securities, franchises, or other financial instruments, particularly in jurisdictions where such activity would be unlawful.
All content is of a general nature and may not address the specific circumstances of any individual or entity. It is not a substitute for professional advice or services. Any actions you take based on the information provided here are strictly at your own risk. You accept full responsibility for any decisions or outcomes arising from your use of this website and agree to release us from any liability in connection with your use of, or reliance upon, the content or products found herein.