
|
Mys Group Co., Ltd. (002303.SZ) Valation DCF |
Entièrement Modifiable: Adapté À Vos Besoins Dans Excel Ou Sheets
Conception Professionnelle: Modèles Fiables Et Conformes Aux Normes Du Secteur
Pré-Construits Pour Une Utilisation Rapide Et Efficace
Compatible MAC/PC, entièrement débloqué
Aucune Expertise N'Est Requise; Facile À Suivre
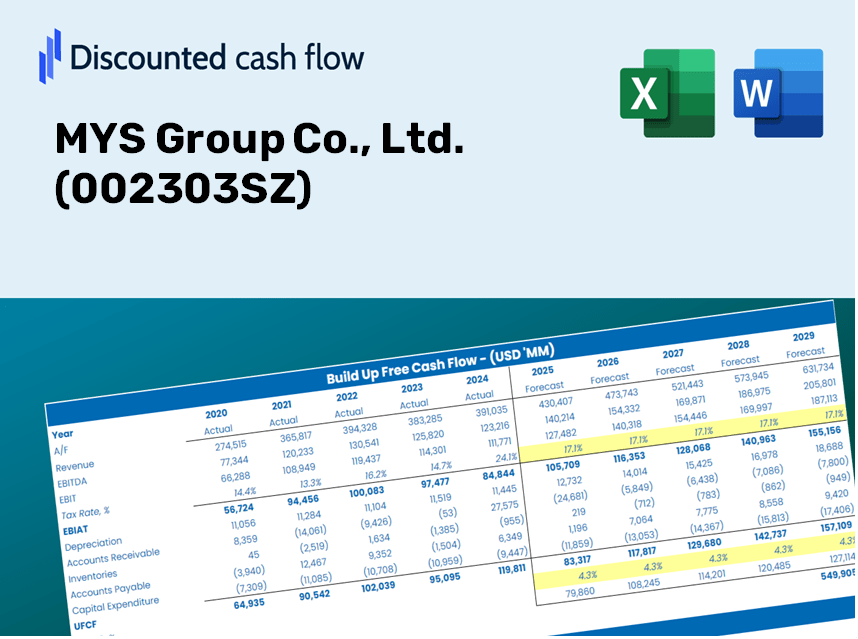
MYS Group Co., Ltd. (002303.SZ) Bundle
Explorez le potentiel financier de MyS Group Co., Ltd. (002303SZ) avec notre calculatrice DCF conviviale! Entrez vos prévisions de croissance, de marges et de dépenses pour calculer la valeur intrinsèque de MyS Group Co., Ltd. (002303SZ) et améliorez vos décisions d'investissement.
Discounted Cash Flow (DCF) - (USD MM)
| Year | AY1 2020 |
AY2 2021 |
AY3 2022 |
AY4 2023 |
AY5 2024 |
FY1 2025 |
FY2 2026 |
FY3 2027 |
FY4 2028 |
FY5 2029 |
|---|---|---|---|---|---|---|---|---|---|---|
| Revenue | 3,365.3 | 3,605.2 | 4,129.6 | 3,513.0 | 4,007.2 | 4,215.7 | 4,435.1 | 4,665.8 | 4,908.6 | 5,164.0 |
| Revenue Growth, % | 0 | 7.13 | 14.55 | -14.93 | 14.07 | 5.2 | 5.2 | 5.2 | 5.2 | 5.2 |
| EBITDA | 321.9 | 316.1 | 368.1 | 415.2 | 528.6 | 440.6 | 463.5 | 487.6 | 513.0 | 539.7 |
| EBITDA, % | 9.57 | 8.77 | 8.91 | 11.82 | 13.19 | 10.45 | 10.45 | 10.45 | 10.45 | 10.45 |
| Depreciation | 128.1 | 173.2 | 194.1 | 159.5 | 160.7 | 184.3 | 193.9 | 204.0 | 214.6 | 225.8 |
| Depreciation, % | 3.81 | 4.8 | 4.7 | 4.54 | 4.01 | 4.37 | 4.37 | 4.37 | 4.37 | 4.37 |
| EBIT | 193.8 | 142.9 | 174.0 | 255.7 | 367.9 | 256.3 | 269.6 | 283.6 | 298.4 | 313.9 |
| EBIT, % | 5.76 | 3.96 | 4.21 | 7.28 | 9.18 | 6.08 | 6.08 | 6.08 | 6.08 | 6.08 |
| Total Cash | 1,236.3 | 1,075.1 | 1,568.2 | 2,161.0 | 1,479.1 | 1,711.2 | 1,800.3 | 1,893.9 | 1,992.5 | 2,096.2 |
| Total Cash, percent | .0 | .0 | .0 | .0 | .0 | .0 | .0 | .0 | .0 | .0 |
| Account Receivables | 1,228.7 | 1,308.6 | 1,310.1 | 1,209.9 | 1,332.3 | 1,452.1 | 1,527.6 | 1,607.1 | 1,690.8 | 1,778.7 |
| Account Receivables, % | 36.51 | 36.3 | 31.73 | 34.44 | 33.25 | 34.44 | 34.44 | 34.44 | 34.44 | 34.44 |
| Inventories | 760.7 | 717.7 | 415.8 | 364.9 | 369.4 | 608.7 | 640.3 | 673.6 | 708.7 | 745.6 |
| Inventories, % | 22.6 | 19.91 | 10.07 | 10.39 | 9.22 | 14.44 | 14.44 | 14.44 | 14.44 | 14.44 |
| Accounts Payable | 1,220.6 | 1,214.0 | 1,215.6 | 1,086.1 | 1,089.6 | 1,327.9 | 1,396.9 | 1,469.6 | 1,546.1 | 1,626.6 |
| Accounts Payable, % | 36.27 | 33.68 | 29.43 | 30.92 | 27.19 | 31.5 | 31.5 | 31.5 | 31.5 | 31.5 |
| Capital Expenditure | -401.8 | -349.7 | -251.7 | -109.7 | -116.7 | -284.7 | -299.5 | -315.1 | -331.5 | -348.8 |
| Capital Expenditure, % | -11.94 | -9.7 | -6.09 | -3.12 | -2.91 | -6.75 | -6.75 | -6.75 | -6.75 | -6.75 |
| Tax Rate, % | 14.98 | 14.98 | 14.98 | 14.98 | 14.98 | 14.98 | 14.98 | 14.98 | 14.98 | 14.98 |
| EBITAT | 166.9 | 124.8 | 140.6 | 218.0 | 312.7 | 217.6 | 228.9 | 240.8 | 253.3 | 266.5 |
| Depreciation | ||||||||||
| Changes in Account Receivables | ||||||||||
| Changes in Inventories | ||||||||||
| Changes in Accounts Payable | ||||||||||
| Capital Expenditure | ||||||||||
| UFCF | -875.5 | -95.3 | 384.9 | 289.5 | 233.3 | -3.6 | 85.1 | 89.6 | 94.2 | 99.1 |
| WACC, % | 5.06 | 5.07 | 5.03 | 5.06 | 5.06 | 5.05 | 5.05 | 5.05 | 5.05 | 5.05 |
| PV UFCF | ||||||||||
| SUM PV UFCF | 305.8 | |||||||||
| Long Term Growth Rate, % | 2.00 | |||||||||
| Free cash flow (T + 1) | 101 | |||||||||
| Terminal Value | 3,310 | |||||||||
| Present Terminal Value | 2,587 | |||||||||
| Enterprise Value | 2,893 | |||||||||
| Net Debt | -524 | |||||||||
| Equity Value | 3,417 | |||||||||
| Diluted Shares Outstanding, MM | 1,531 | |||||||||
| Equity Value Per Share | 2.23 |
What You Will Receive
- Customizable Excel Template: An adaptable Excel-based DCF Calculator featuring pre-filled financials for MYS Group Co., Ltd. (002303SZ).
- Real-Time Data: Access to historical figures and future projections (highlighted in the yellow cells).
- Adjustable Forecasts: Modify key assumptions such as revenue growth, EBITDA percentage, and WACC.
- Instant Calculations: Quickly observe how your inputs affect MYS Group Co., Ltd.'s (002303SZ) valuation.
- Professional Resource: Designed for investors, CFOs, consultants, and financial analysts.
- User-Friendly Interface: Organized for ease of understanding and navigation, complete with step-by-step guidance.
Key Features
- 🔍 Real-Life MYS Group Financials: Pre-filled historical and projected data for MYS Group Co., Ltd. (002303SZ).
- ✏️ Fully Customizable Inputs: Modify all essential parameters (yellow cells) such as WACC, growth %, and tax rates.
- 📊 Professional DCF Valuation: Integrated formulas assess MYS Group’s intrinsic value using the Discounted Cash Flow method.
- ⚡ Instant Results: Visualize MYS Group’s valuation immediately after adjustments.
- Scenario Analysis: Explore and compare results for different financial assumptions side-by-side.
How It Functions
- Step 1: Download the prebuilt Excel template featuring MYS Group Co., Ltd.’s (002303SZ) data.
- Step 2: Review the pre-filled sheets to familiarize yourself with the essential metrics.
- Step 3: Modify forecasts and assumptions within the editable yellow cells (WACC, growth, margins).
- Step 4: Instantly see updated results, including the intrinsic value of MYS Group Co., Ltd. (002303SZ).
- Step 5: Make well-informed investment decisions or create reports based on the results.
Why Choose MYS Group Co., Ltd. (002303SZ)?
- Precision: Utilizes authentic MYS Group financial data for reliable results.
- Adaptability: Built for users to easily experiment with and alter inputs.
- Efficiency: Eliminate the need to construct a financial model from the ground up.
- Expert-Level: Crafted with the accuracy and functionality expected by finance professionals.
- Intuitive: Simple to navigate, even for those without deep financial modeling expertise.
Who Can Benefit from MYS Group Co., Ltd. (002303SZ)?
- Finance Students: Explore valuation methodologies and apply them with real-world data.
- Academics: Utilize industry-standard models in your research or educational programs.
- Investors: Validate your hypotheses and assess valuation results for MYS Group Co., Ltd. (002303SZ).
- Analysts: Enhance your efficiency with a ready-made, customizable DCF model.
- Small Business Owners: Understand how major public companies like MYS Group Co., Ltd. (002303SZ) are evaluated.
Contents of the Template
- Operating and Balance Sheet Data: Pre-filled historical data and forecasts for MYS Group Co., Ltd. (002303SZ), encompassing revenue, EBITDA, EBIT, and capital expenditures.
- WACC Calculation: A dedicated worksheet for the Weighted Average Cost of Capital (WACC), featuring parameters such as Beta, risk-free rate, and share price.
- DCF Valuation (Unlevered and Levered): Customizable Discounted Cash Flow models illustrating intrinsic value along with comprehensive calculations.
- Financial Statements: Pre-loaded annual and quarterly financial statements to facilitate thorough analysis.
- Key Ratios: Includes profitability, leverage, and efficiency ratios specific to MYS Group Co., Ltd. (002303SZ).
- Dashboard and Charts: A visual overview of valuation outputs and assumptions for easy result analysis.
Disclaimer
All information, articles, and product details provided on this website are for general informational and educational purposes only. We do not claim any ownership over, nor do we intend to infringe upon, any trademarks, copyrights, logos, brand names, or other intellectual property mentioned or depicted on this site. Such intellectual property remains the property of its respective owners, and any references here are made solely for identification or informational purposes, without implying any affiliation, endorsement, or partnership.
We make no representations or warranties, express or implied, regarding the accuracy, completeness, or suitability of any content or products presented. Nothing on this website should be construed as legal, tax, investment, financial, medical, or other professional advice. In addition, no part of this site—including articles or product references—constitutes a solicitation, recommendation, endorsement, advertisement, or offer to buy or sell any securities, franchises, or other financial instruments, particularly in jurisdictions where such activity would be unlawful.
All content is of a general nature and may not address the specific circumstances of any individual or entity. It is not a substitute for professional advice or services. Any actions you take based on the information provided here are strictly at your own risk. You accept full responsibility for any decisions or outcomes arising from your use of this website and agree to release us from any liability in connection with your use of, or reliance upon, the content or products found herein.