
|
Shenzhen Hemei Group Co., Ltd. (002356.SZ) Évaluation DCF |
Entièrement Modifiable: Adapté À Vos Besoins Dans Excel Ou Sheets
Conception Professionnelle: Modèles Fiables Et Conformes Aux Normes Du Secteur
Pré-Construits Pour Une Utilisation Rapide Et Efficace
Compatible MAC/PC, entièrement débloqué
Aucune Expertise N'Est Requise; Facile À Suivre
Shenzhen Hemei Group Co.,LTD. (002356.SZ) Bundle
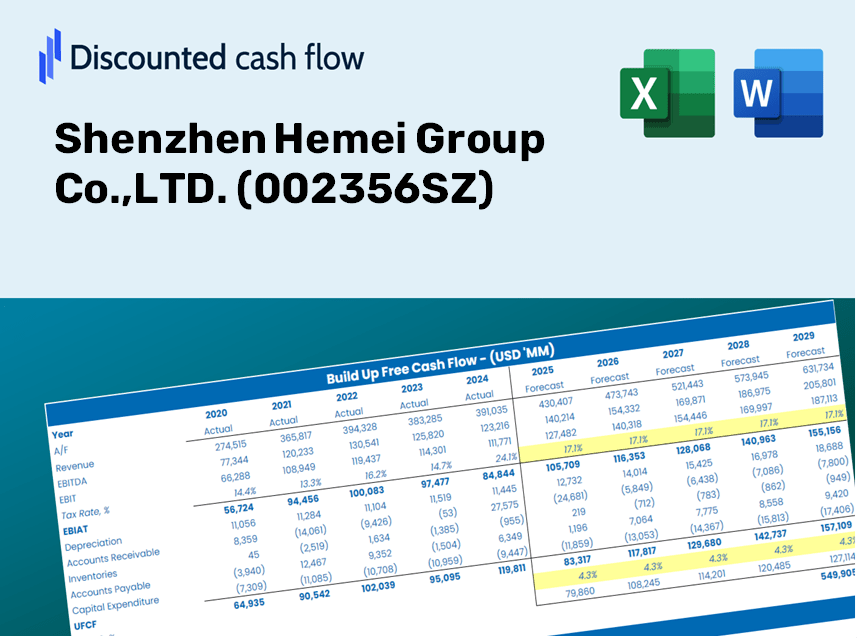
Évaluez Shenzhen Hemei Group Co., Ltd. Perspectives financières de l'expertise! Cette calculatrice DCF (002356SZ) fournit des données financières pré-remplies ainsi que la flexibilité de modification de la croissance des revenus, du WACC, des marges et d'autres hypothèses critiques pour s'aligner sur vos prévisions.
Discounted Cash Flow (DCF) - (USD MM)
| Year | AY1 2020 |
AY2 2021 |
AY3 2022 |
AY4 2023 |
AY5 2024 |
FY1 2025 |
FY2 2026 |
FY3 2027 |
FY4 2028 |
FY5 2029 |
|---|---|---|---|---|---|---|---|---|---|---|
| Revenue | 466.5 | 332.8 | 162.4 | 165.0 | 406.6 | 428.7 | 452.0 | 476.5 | 502.4 | 529.7 |
| Revenue Growth, % | 0 | -28.67 | -51.21 | 1.61 | 146.43 | 5.43 | 5.43 | 5.43 | 5.43 | 5.43 |
| EBITDA | -448.0 | 1,104.4 | -63.3 | -39.3 | -75.8 | -66.4 | -70.1 | -73.9 | -77.9 | -82.1 |
| EBITDA, % | -96.03 | 331.85 | -39.01 | -23.82 | -18.64 | -15.5 | -15.5 | -15.5 | -15.5 | -15.5 |
| Depreciation | 32.4 | 30.5 | 22.7 | 11.2 | 9.1 | 33.5 | 35.3 | 37.2 | 39.3 | 41.4 |
| Depreciation, % | 6.94 | 9.17 | 13.96 | 6.79 | 2.23 | 7.82 | 7.82 | 7.82 | 7.82 | 7.82 |
| EBIT | -480.4 | 1,073.9 | -86.0 | -50.5 | -84.9 | -89.6 | -94.4 | -99.5 | -105.0 | -110.7 |
| EBIT, % | -102.97 | 322.68 | -52.97 | -30.61 | -20.87 | -20.89 | -20.89 | -20.89 | -20.89 | -20.89 |
| Total Cash | 118.1 | 639.6 | 563.0 | 545.7 | 243.8 | 330.3 | 348.2 | 367.2 | 387.1 | 408.2 |
| Total Cash, percent | .0 | .0 | .0 | .0 | .0 | .0 | .0 | .0 | .0 | .0 |
| Account Receivables | 221.1 | 98.7 | 28.0 | 35.8 | 58.1 | 111.7 | 117.7 | 124.1 | 130.9 | 138.0 |
| Account Receivables, % | 47.39 | 29.67 | 17.23 | 21.68 | 14.29 | 26.05 | 26.05 | 26.05 | 26.05 | 26.05 |
| Inventories | 162.2 | 93.1 | 73.5 | 67.6 | 58.1 | 140.0 | 147.6 | 155.6 | 164.1 | 173.0 |
| Inventories, % | 34.77 | 27.97 | 45.28 | 40.96 | 14.29 | 32.65 | 32.65 | 32.65 | 32.65 | 32.65 |
| Accounts Payable | 140.7 | 18.4 | 17.2 | 8.1 | 42.2 | 52.7 | 55.6 | 58.6 | 61.8 | 65.2 |
| Accounts Payable, % | 30.15 | 5.53 | 10.57 | 4.89 | 10.37 | 12.3 | 12.3 | 12.3 | 12.3 | 12.3 |
| Capital Expenditure | -5.5 | -9.2 | -7.2 | -3.1 | -101.6 | -30.2 | -31.8 | -33.6 | -35.4 | -37.3 |
| Capital Expenditure, % | -1.17 | -2.75 | -4.43 | -1.9 | -24.98 | -7.05 | -7.05 | -7.05 | -7.05 | -7.05 |
| Tax Rate, % | 15.58 | 15.58 | 15.58 | 15.58 | 15.58 | 15.58 | 15.58 | 15.58 | 15.58 | 15.58 |
| EBITAT | -480.8 | 1,084.4 | -167.1 | -47.0 | -71.6 | -85.5 | -90.1 | -95.0 | -100.2 | -105.7 |
| Depreciation | ||||||||||
| Changes in Account Receivables | ||||||||||
| Changes in Inventories | ||||||||||
| Changes in Accounts Payable | ||||||||||
| Capital Expenditure | ||||||||||
| UFCF | -696.6 | 1,175.0 | -62.6 | -49.8 | -142.9 | -207.0 | -97.5 | -102.8 | -108.4 | -114.2 |
| WACC, % | 4.56 | 4.56 | 4.56 | 4.56 | 4.56 | 4.56 | 4.56 | 4.56 | 4.56 | 4.56 |
| PV UFCF | ||||||||||
| SUM PV UFCF | -559.1 | |||||||||
| Long Term Growth Rate, % | 2.00 | |||||||||
| Free cash flow (T + 1) | -117 | |||||||||
| Terminal Value | -4,550 | |||||||||
| Present Terminal Value | -3,640 | |||||||||
| Enterprise Value | -4,199 | |||||||||
| Net Debt | -202 | |||||||||
| Equity Value | -3,997 | |||||||||
| Diluted Shares Outstanding, MM | 1,312 | |||||||||
| Equity Value Per Share | -3.05 |
What You Will Receive
- Pre-Filled Financial Model: Utilize Shenzhen Hemei Group's (002356SZ) actual data for accurate DCF valuation.
- Comprehensive Forecast Control: Modify revenue growth, profit margins, WACC, and other essential drivers.
- Real-Time Calculations: Enjoy automatic updates that reflect changes instantly.
- Investor-Ready Template: A polished Excel file crafted for high-quality valuation analysis.
- Customizable and Reusable: Designed for adaptability, enabling repeated use for in-depth forecasting.
Key Features
- Comprehensive DCF Calculator: Offers detailed unlevered and levered DCF valuation models tailored for Shenzhen Hemei Group Co., LTD. (002356SZ).
- WACC Calculator: Features a pre-built Weighted Average Cost of Capital sheet with customizable parameters to suit your analysis.
- Customizable Forecast Assumptions: Easily adjust growth rates, capital expenditures, and discount rates to reflect your projections.
- Integrated Financial Ratios: Evaluate profitability, leverage, and efficiency ratios specifically for Shenzhen Hemei Group Co., LTD. (002356SZ).
- Interactive Dashboard and Charts: Visual representations provide a summary of essential valuation metrics for straightforward analysis.
How It Functions
- Download the Template: Gain immediate access to the Excel-based Shenzhen Hemei Group DCF Calculator.
- Input Your Assumptions: Modify the yellow-highlighted cells for growth rates, WACC, profit margins, and other variables.
- Instant Calculations: The model automatically calculates the intrinsic value of Shenzhen Hemei Group (002356SZ).
- Test Scenarios: Experiment with various assumptions to assess potential valuation impacts.
- Analyze and Decide: Utilize the results to inform your investment strategies or financial evaluations.
Why Opt for the Hemei Group Calculator?
- Reliable Data: Authentic financial information for Shenzhen Hemei Group Co., LTD. guarantees trustworthy valuation outcomes.
- Tailorable: Modify essential factors such as growth rates, WACC, and tax rates to align with your forecasts.
- Efficient: Integrated calculations save you the hassle of starting from the ground up.
- High-Caliber Tool: Crafted for investors, analysts, and consultants alike.
- Easy to Use: Clear design and guided instructions ensure accessibility for users of all experience levels.
Who Can Benefit from Shenzhen Hemei Group Co., LTD. (002356SZ)?
- Investors: Make informed decisions with a top-tier valuation tool tailored for analyzing (002356SZ).
- Financial Analysts: Streamline your workflow with our customizable DCF model specifically designed for (002356SZ).
- Consultants: Easily modify the template for client presentations or reports focusing on (002356SZ).
- Finance Enthusiasts: Enhance your knowledge of valuation methods with real-life examples related to (002356SZ).
- Educators and Students: Utilize this resource as a hands-on learning tool in finance courses that cover (002356SZ).
Features of the Template
- Operating and Balance Sheet Data: Pre-filled historical data and forecasts for Shenzhen Hemei Group Co., LTD. (002356SZ), including revenue, EBITDA, EBIT, and capital expenditures.
- WACC Calculation: A dedicated sheet for calculating the Weighted Average Cost of Capital (WACC), featuring parameters such as Beta, risk-free rate, and share price.
- DCF Valuation (Unlevered and Levered): Editable Discounted Cash Flow models demonstrating intrinsic value with detailed calculations for analysis.
- Financial Statements: Pre-loaded financial statements (annual and quarterly) to facilitate comprehensive analysis.
- Key Ratios: Contains profitability, leverage, and efficiency ratios specifically for Shenzhen Hemei Group Co., LTD. (002356SZ).
- Dashboard and Charts: Visual representation of valuation outputs and underlying assumptions for easy analysis of results.
Disclaimer
All information, articles, and product details provided on this website are for general informational and educational purposes only. We do not claim any ownership over, nor do we intend to infringe upon, any trademarks, copyrights, logos, brand names, or other intellectual property mentioned or depicted on this site. Such intellectual property remains the property of its respective owners, and any references here are made solely for identification or informational purposes, without implying any affiliation, endorsement, or partnership.
We make no representations or warranties, express or implied, regarding the accuracy, completeness, or suitability of any content or products presented. Nothing on this website should be construed as legal, tax, investment, financial, medical, or other professional advice. In addition, no part of this site—including articles or product references—constitutes a solicitation, recommendation, endorsement, advertisement, or offer to buy or sell any securities, franchises, or other financial instruments, particularly in jurisdictions where such activity would be unlawful.
All content is of a general nature and may not address the specific circumstances of any individual or entity. It is not a substitute for professional advice or services. Any actions you take based on the information provided here are strictly at your own risk. You accept full responsibility for any decisions or outcomes arising from your use of this website and agree to release us from any liability in connection with your use of, or reliance upon, the content or products found herein.