
|
Zhejiang Weixing New Building Materials Co., Ltd. (002372.SZ) Valation DCF |
Entièrement Modifiable: Adapté À Vos Besoins Dans Excel Ou Sheets
Conception Professionnelle: Modèles Fiables Et Conformes Aux Normes Du Secteur
Pré-Construits Pour Une Utilisation Rapide Et Efficace
Compatible MAC/PC, entièrement débloqué
Aucune Expertise N'Est Requise; Facile À Suivre
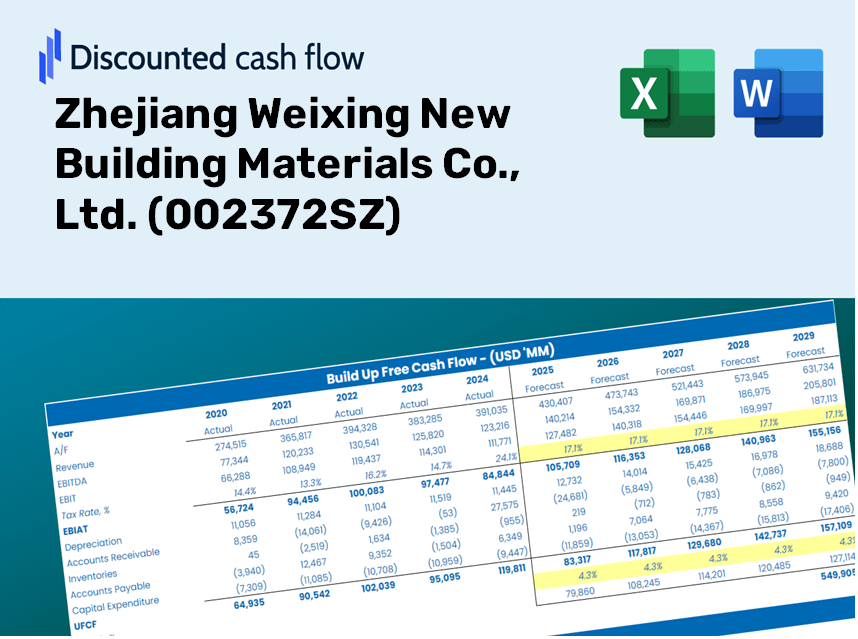
Zhejiang Weixing New Building Materials Co., Ltd. (002372.SZ) Bundle
Gardez un aperçu de votre analyse d'évaluation de votre Zhejiang Weixing New Building Materials Co., Ltd. (002372SZ) avec notre calculatrice DCF de pointe! Avec des données en temps réel (002372SZ), ce modèle Excel vous permet d'ajuster les prévisions et les hypothèses pour déterminer avec précision la valeur intrinsèque de Zhejiang Weixing New Building Materials Co., Ltd.
Discounted Cash Flow (DCF) - (USD MM)
| Year | AY1 2020 |
AY2 2021 |
AY3 2022 |
AY4 2023 |
AY5 2024 |
FY1 2025 |
FY2 2026 |
FY3 2027 |
FY4 2028 |
FY5 2029 |
|---|---|---|---|---|---|---|---|---|---|---|
| Revenue | 5,104.8 | 6,387.6 | 6,953.6 | 6,378.3 | 6,266.6 | 6,642.0 | 7,040.0 | 7,461.8 | 7,908.8 | 8,382.7 |
| Revenue Growth, % | 0 | 25.13 | 8.86 | -8.27 | -1.75 | 5.99 | 5.99 | 5.99 | 5.99 | 5.99 |
| EBITDA | 1,510.4 | 1,578.3 | 1,709.0 | 1,892.0 | 1,314.5 | 1,720.4 | 1,823.5 | 1,932.8 | 2,048.6 | 2,171.3 |
| EBITDA, % | 29.59 | 24.71 | 24.58 | 29.66 | 20.98 | 25.9 | 25.9 | 25.9 | 25.9 | 25.9 |
| Depreciation | 134.3 | 146.3 | 151.3 | 159.9 | 172.3 | 164.1 | 173.9 | 184.4 | 195.4 | 207.1 |
| Depreciation, % | 2.63 | 2.29 | 2.18 | 2.51 | 2.75 | 2.47 | 2.47 | 2.47 | 2.47 | 2.47 |
| EBIT | 1,376.0 | 1,432.0 | 1,557.7 | 1,732.1 | 1,142.2 | 1,556.3 | 1,649.6 | 1,748.4 | 1,853.2 | 1,964.2 |
| EBIT, % | 26.96 | 22.42 | 22.4 | 27.16 | 18.23 | 23.43 | 23.43 | 23.43 | 23.43 | 23.43 |
| Total Cash | 2,136.6 | 2,573.8 | 3,177.5 | 3,174.5 | 2,533.7 | 2,896.6 | 3,070.1 | 3,254.0 | 3,449.0 | 3,655.6 |
| Total Cash, percent | .0 | .0 | .0 | .0 | .0 | .0 | .0 | .0 | .0 | .0 |
| Account Receivables | 400.7 | 409.5 | 523.9 | 595.0 | 631.2 | 547.2 | 580.0 | 614.8 | 651.6 | 690.6 |
| Account Receivables, % | 7.85 | 6.41 | 7.53 | 9.33 | 10.07 | 8.24 | 8.24 | 8.24 | 8.24 | 8.24 |
| Inventories | 768.8 | 1,073.0 | 891.6 | 1,015.5 | 951.4 | 1,006.7 | 1,067.1 | 1,131.0 | 1,198.8 | 1,270.6 |
| Inventories, % | 15.06 | 16.8 | 12.82 | 15.92 | 15.18 | 15.16 | 15.16 | 15.16 | 15.16 | 15.16 |
| Accounts Payable | 399.3 | 385.3 | 438.3 | 496.7 | 502.3 | 477.7 | 506.3 | 536.7 | 568.8 | 602.9 |
| Accounts Payable, % | 7.82 | 6.03 | 6.3 | 7.79 | 8.02 | 7.19 | 7.19 | 7.19 | 7.19 | 7.19 |
| Capital Expenditure | -215.6 | -233.1 | -217.3 | -382.4 | -353.6 | -300.7 | -318.7 | -337.8 | -358.1 | -379.5 |
| Capital Expenditure, % | -4.22 | -3.65 | -3.13 | -6 | -5.64 | -4.53 | -4.53 | -4.53 | -4.53 | -4.53 |
| Tax Rate, % | 16.57 | 16.57 | 16.57 | 16.57 | 16.57 | 16.57 | 16.57 | 16.57 | 16.57 | 16.57 |
| EBITAT | 1,185.4 | 1,216.8 | 1,316.6 | 1,432.6 | 953.0 | 1,312.9 | 1,391.5 | 1,474.9 | 1,563.3 | 1,656.9 |
| Depreciation | ||||||||||
| Changes in Account Receivables | ||||||||||
| Changes in Inventories | ||||||||||
| Changes in Accounts Payable | ||||||||||
| Capital Expenditure | ||||||||||
| UFCF | 333.7 | 803.1 | 1,370.6 | 1,073.6 | 805.1 | 1,180.2 | 1,182.3 | 1,253.1 | 1,328.2 | 1,407.7 |
| WACC, % | 6.5 | 6.5 | 6.5 | 6.5 | 6.5 | 6.5 | 6.5 | 6.5 | 6.5 | 6.5 |
| PV UFCF | ||||||||||
| SUM PV UFCF | 5,247.6 | |||||||||
| Long Term Growth Rate, % | 3.00 | |||||||||
| Free cash flow (T + 1) | 1,450 | |||||||||
| Terminal Value | 41,409 | |||||||||
| Present Terminal Value | 30,221 | |||||||||
| Enterprise Value | 35,469 | |||||||||
| Net Debt | -1,715 | |||||||||
| Equity Value | 37,183 | |||||||||
| Diluted Shares Outstanding, MM | 1,572 | |||||||||
| Equity Value Per Share | 23.66 |
What You Will Receive
- Customizable Excel Template: An adaptable Excel-based DCF Calculator featuring pre-filled financials for Zhejiang Weixing New Building Materials Co., Ltd. (002372SZ).
- Comprehensive Data: Historical information and projected estimates (highlighted in the designated cells).
- Adjustable Forecasting: Modify key assumptions such as revenue growth, EBITDA margin, and WACC.
- Instant Calculations: Quickly observe how your inputs influence the valuation of Zhejiang Weixing New Building Materials Co., Ltd. (002372SZ).
- Professional Resource: Designed for investors, CFOs, consultants, and finance professionals.
- Intuitive Layout: Organized for simplicity and usability, complete with guided instructions.
Key Features
- Customizable Forecast Settings: Tailor essential inputs such as revenue growth, EBITDA percentage, and capital expenditures for [002372SZ].
- Instant Automated DCF Valuation: Effortlessly calculates intrinsic value, NPV, and additional financial metrics.
- Precision Like a Pro: Leverages real-world financial data from Zhejiang Weixing for accurate valuation results.
- Effortless Scenario Analysis: Evaluate various assumptions and analyze results with ease.
- Efficiency Booster: Save time by avoiding the complexity of building intricate valuation models from the ground up.
How It Works
- Download: Obtain the pre-prepared Excel file featuring Zhejiang Weixing New Building Materials Co., Ltd.'s (002372SZ) financial data.
- Customize: Modify projections, including revenue growth rates, EBITDA margins, and WACC figures.
- Update Automatically: Watch as intrinsic value and NPV calculations refresh in real-time.
- Test Scenarios: Formulate various projections and instantly compare results.
- Make Decisions: Leverage the valuation insights to inform your investment approach.
Reasons to Use This Calculator for Zhejiang Weixing New Building Materials Co., Ltd. (002372SZ)
- Precision: Utilizes accurate financial data from Zhejiang Weixing for reliable results.
- Versatility: Built to allow users to easily adjust and experiment with various inputs.
- Efficiency: Avoid the complexities of creating a financial model from the ground up.
- High-Quality: Crafted with the expertise and standards expected at the CFO level.
- Intuitive: Simple interface that accommodates users with varying financial backgrounds.
Who Should Utilize This Product?
- Individual Investors: Gain insights to make informed decisions regarding investments in Zhejiang Weixing New Building Materials Co., Ltd. (002372SZ).
- Financial Analysts: Enhance valuation methodologies with accessible and comprehensive financial models specific to Zhejiang Weixing New Building Materials Co., Ltd. (002372SZ).
- Consultants: Provide clients with precise and timely valuation analysis related to Zhejiang Weixing New Building Materials Co., Ltd. (002372SZ).
- Business Owners: Learn how valuation is approached for large firms like Zhejiang Weixing New Building Materials Co., Ltd. (002372SZ) to inform your own business strategies.
- Finance Students: Explore valuation practices using real-world data and scenarios involving Zhejiang Weixing New Building Materials Co., Ltd. (002372SZ).
Contents of the Template
- Detailed DCF Model: Editable template featuring in-depth valuation calculations.
- Market Data: Historical and projected financials for Zhejiang Weixing New Building Materials Co., Ltd. (002372SZ) already included for analysis.
- Adjustable Inputs: Modify WACC, growth rates, and tax assumptions to explore different scenarios.
- Comprehensive Financial Statements: Complete annual and quarterly reports for enhanced insights.
- Essential Ratios: Integrated analysis covering profitability, efficiency, and leverage metrics.
- Interactive Dashboard with Visual Data: Charts and tables designed for clear and actionable insights.
Disclaimer
All information, articles, and product details provided on this website are for general informational and educational purposes only. We do not claim any ownership over, nor do we intend to infringe upon, any trademarks, copyrights, logos, brand names, or other intellectual property mentioned or depicted on this site. Such intellectual property remains the property of its respective owners, and any references here are made solely for identification or informational purposes, without implying any affiliation, endorsement, or partnership.
We make no representations or warranties, express or implied, regarding the accuracy, completeness, or suitability of any content or products presented. Nothing on this website should be construed as legal, tax, investment, financial, medical, or other professional advice. In addition, no part of this site—including articles or product references—constitutes a solicitation, recommendation, endorsement, advertisement, or offer to buy or sell any securities, franchises, or other financial instruments, particularly in jurisdictions where such activity would be unlawful.
All content is of a general nature and may not address the specific circumstances of any individual or entity. It is not a substitute for professional advice or services. Any actions you take based on the information provided here are strictly at your own risk. You accept full responsibility for any decisions or outcomes arising from your use of this website and agree to release us from any liability in connection with your use of, or reliance upon, the content or products found herein.