
|
Suzhou Dongshan Precision Manufacturing Co., Ltd. (002384.SZ) Valation DCF |
Entièrement Modifiable: Adapté À Vos Besoins Dans Excel Ou Sheets
Conception Professionnelle: Modèles Fiables Et Conformes Aux Normes Du Secteur
Pré-Construits Pour Une Utilisation Rapide Et Efficace
Compatible MAC/PC, entièrement débloqué
Aucune Expertise N'Est Requise; Facile À Suivre
Suzhou Dongshan Precision Manufacturing Co., Ltd. (002384.SZ) Bundle
Gardez un aperçu de votre analyse d'évaluation Suzhou Dongshan Precision Manufacturing Co., Ltd. (002384SZ) en utilisant notre calculatrice sophistiquée DCF! Ce modèle Excel est préchargé avec des données réelles (002384SZ), vous permettant d'ajuster les prévisions et les hypothèses pour un calcul précis de la valeur intrinsèque de Suzhou Dongshan.
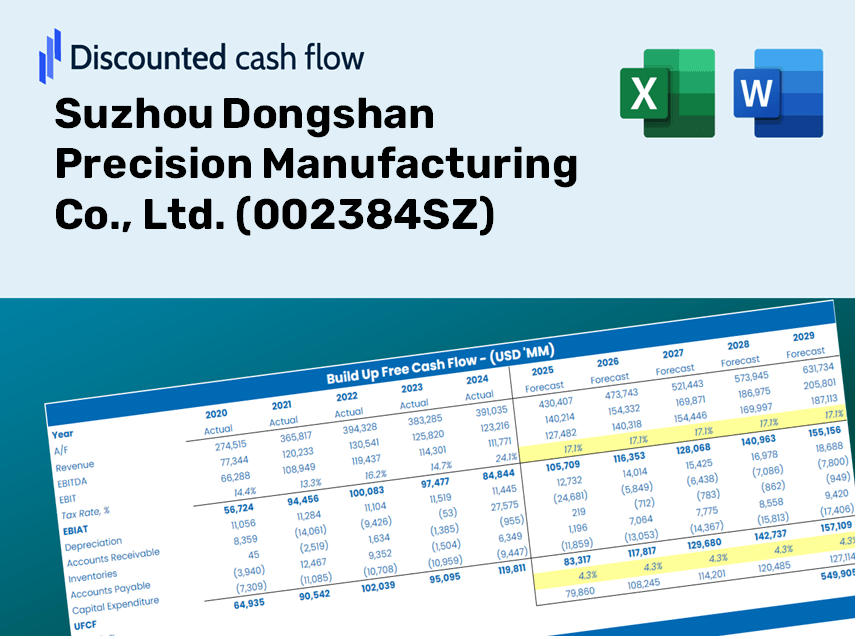
Discounted Cash Flow (DCF) - (USD MM)
| Year | AY1 2020 |
AY2 2021 |
AY3 2022 |
AY4 2023 |
AY5 2024 |
FY1 2025 |
FY2 2026 |
FY3 2027 |
FY4 2028 |
FY5 2029 |
|---|---|---|---|---|---|---|---|---|---|---|
| Revenue | 28,093.4 | 31,793.1 | 31,580.1 | 33,651.2 | 36,770.4 | 39,374.3 | 42,162.7 | 45,148.5 | 48,345.8 | 51,769.5 |
| Revenue Growth, % | 0 | 13.17 | -0.66996 | 6.56 | 9.27 | 7.08 | 7.08 | 7.08 | 7.08 | 7.08 |
| EBITDA | 3,682.2 | 3,884.4 | 4,582.8 | 3,984.4 | 3,866.8 | 4,897.6 | 5,244.5 | 5,615.9 | 6,013.5 | 6,439.4 |
| EBITDA, % | 13.11 | 12.22 | 14.51 | 11.84 | 10.52 | 12.44 | 12.44 | 12.44 | 12.44 | 12.44 |
| Depreciation | 1,509.2 | 1,629.8 | 1,755.5 | 1,913.3 | 2,170.3 | 2,177.1 | 2,331.2 | 2,496.3 | 2,673.1 | 2,862.4 |
| Depreciation, % | 5.37 | 5.13 | 5.56 | 5.69 | 5.9 | 5.53 | 5.53 | 5.53 | 5.53 | 5.53 |
| EBIT | 2,173.0 | 2,254.6 | 2,827.3 | 2,071.1 | 1,696.4 | 2,720.6 | 2,913.2 | 3,119.5 | 3,340.5 | 3,577.0 |
| EBIT, % | 7.73 | 7.09 | 8.95 | 6.15 | 4.61 | 6.91 | 6.91 | 6.91 | 6.91 | 6.91 |
| Total Cash | 6,416.0 | 5,900.4 | 7,707.0 | 7,336.2 | 7,250.5 | 8,451.3 | 9,049.8 | 9,690.7 | 10,377.0 | 11,111.8 |
| Total Cash, percent | .0 | .0 | .0 | .0 | .0 | .0 | .0 | .0 | .0 | .0 |
| Account Receivables | 7,911.7 | 8,509.1 | 7,698.9 | 8,084.2 | 7,970.9 | 9,844.1 | 10,541.2 | 11,287.7 | 12,087.0 | 12,943.0 |
| Account Receivables, % | 28.16 | 26.76 | 24.38 | 24.02 | 21.68 | 25 | 25 | 25 | 25 | 25 |
| Inventories | 5,977.1 | 6,451.7 | 6,165.7 | 6,293.9 | 6,152.7 | 7,601.5 | 8,139.8 | 8,716.3 | 9,333.5 | 9,994.5 |
| Inventories, % | 21.28 | 20.29 | 19.52 | 18.7 | 16.73 | 19.31 | 19.31 | 19.31 | 19.31 | 19.31 |
| Accounts Payable | 9,211.2 | 8,376.5 | 5,986.3 | 8,948.3 | 10,594.9 | 10,512.6 | 11,257.0 | 12,054.2 | 12,907.9 | 13,822.0 |
| Accounts Payable, % | 32.79 | 26.35 | 18.96 | 26.59 | 28.81 | 26.7 | 26.7 | 26.7 | 26.7 | 26.7 |
| Capital Expenditure | -2,390.7 | -3,049.2 | -3,375.0 | -3,466.9 | -3,792.1 | -3,890.4 | -4,165.9 | -4,461.0 | -4,776.9 | -5,115.2 |
| Capital Expenditure, % | -8.51 | -9.59 | -10.69 | -10.3 | -10.31 | -9.88 | -9.88 | -9.88 | -9.88 | -9.88 |
| Tax Rate, % | 26.03 | 26.03 | 26.03 | 26.03 | 26.03 | 26.03 | 26.03 | 26.03 | 26.03 | 26.03 |
| EBITAT | 1,861.4 | 1,989.3 | 2,357.0 | 1,857.0 | 1,254.8 | 2,290.1 | 2,452.3 | 2,625.9 | 2,811.9 | 3,011.0 |
| Depreciation | ||||||||||
| Changes in Account Receivables | ||||||||||
| Changes in Inventories | ||||||||||
| Changes in Accounts Payable | ||||||||||
| Capital Expenditure | ||||||||||
| UFCF | -3,697.8 | -1,336.6 | -556.6 | 2,752.0 | 1,534.0 | -2,827.5 | 126.6 | 135.6 | 145.2 | 155.4 |
| WACC, % | 5.98 | 5.99 | 5.97 | 6 | 5.93 | 5.97 | 5.97 | 5.97 | 5.97 | 5.97 |
| PV UFCF | ||||||||||
| SUM PV UFCF | -2,210.1 | |||||||||
| Long Term Growth Rate, % | 3.50 | |||||||||
| Free cash flow (T + 1) | 161 | |||||||||
| Terminal Value | 6,504 | |||||||||
| Present Terminal Value | 4,866 | |||||||||
| Enterprise Value | 2,656 | |||||||||
| Net Debt | 4,279 | |||||||||
| Equity Value | -1,623 | |||||||||
| Diluted Shares Outstanding, MM | 1,703 | |||||||||
| Equity Value Per Share | -0.95 |
Benefits You Will Receive
- Flexible Forecast Variables: Effortlessly modify key assumptions (growth %, profit margins, WACC) to explore various scenarios.
- Comprehensive Financial Data: Suzhou Dongshan Precision Manufacturing Co., Ltd.’s (002384SZ) financial figures pre-loaded to facilitate your analysis.
- Automated DCF Results: The template calculates Net Present Value (NPV) and intrinsic value automatically for your convenience.
- Tailorable and Professional Design: A sleek Excel model that can be customized to meet your valuation requirements.
- Designed for Analysts and Investors: Perfect for evaluating projections, validating strategies, and enhancing efficiency.
Key Features
- Accurate Financial Data: Gain access to reliable, pre-loaded historical figures and future forecasts for Suzhou Dongshan Precision Manufacturing Co., Ltd. (002384SZ).
- Adjustable Forecast Assumptions: Modify highlighted fields such as WACC, growth rates, and profit margins with ease.
- Real-Time Calculations: Benefit from automatic updates to DCF, Net Present Value (NPV), and cash flow analysis.
- Interactive Dashboard: Utilize clear charts and summaries to effectively visualize your valuation outcomes.
- Suitable for All Skill Levels: A user-friendly format designed for investors, CFOs, and consultants alike.
How It Operates
- Download: Obtain the pre-formulated Excel file featuring Suzhou Dongshan Precision Manufacturing Co., Ltd.'s financial data.
- Customize: Modify projections, including sales growth, EBITDA margin, and discount rates.
- Update Automatically: The calculations for intrinsic value and NPV refresh in real-time.
- Test Scenarios: Develop various forecasts and instantly analyze different results.
- Make Decisions: Utilize the valuation insights to inform your investment approach.
Why Opt for Suzhou Dongshan Precision Manufacturing Co., Ltd. (002384SZ)?
- Efficiency: Skip the hassle of building a model from scratch – our solutions are ready for immediate application.
- Enhanced Accuracy: Dependable financial insights and calculations minimize valuation discrepancies.
- Completely Adaptable: Modify the model to align with your specific assumptions and forecasts.
- User-Friendly Visualization: Intuitive charts and outputs simplify the analysis of results.
- Endorsed by Industry Professionals: Crafted for experts who prioritize accuracy and functionality.
Who Can Benefit from This Product?
- Professional Investors: Develop comprehensive and accurate valuation models for analyzing portfolios involving (002384SZ).
- Corporate Finance Teams: Evaluate valuation scenarios to inform strategic decisions within their organizations.
- Consultants and Advisors: Deliver precise valuation insights to clients focusing on Suzhou Dongshan Precision Manufacturing Co., Ltd. (002384SZ).
- Students and Educators: Leverage real-world data for practical financial modeling exercises and lessons.
- Tech Enthusiasts: Gain insights into how tech manufacturers like Suzhou Dongshan Precision Manufacturing Co., Ltd. (002384SZ) are valued in the marketplace.
Contents of the Template
- Preloaded SDPM Data: Historical and projected financial information, including revenue, EBIT, and capital expenditures.
- DCF and WACC Models: Professional-quality sheets designed to calculate intrinsic value and Weighted Average Cost of Capital.
- Editable Inputs: Yellow-highlighted cells for customizing revenue growth, tax rates, and discount rates.
- Financial Statements: Detailed annual and quarterly financial reports for thorough analysis.
- Key Ratios: Profitability, leverage, and efficiency ratios to assess financial performance.
- Dashboard and Charts: Visual representations of valuation results and underlying assumptions.
Disclaimer
All information, articles, and product details provided on this website are for general informational and educational purposes only. We do not claim any ownership over, nor do we intend to infringe upon, any trademarks, copyrights, logos, brand names, or other intellectual property mentioned or depicted on this site. Such intellectual property remains the property of its respective owners, and any references here are made solely for identification or informational purposes, without implying any affiliation, endorsement, or partnership.
We make no representations or warranties, express or implied, regarding the accuracy, completeness, or suitability of any content or products presented. Nothing on this website should be construed as legal, tax, investment, financial, medical, or other professional advice. In addition, no part of this site—including articles or product references—constitutes a solicitation, recommendation, endorsement, advertisement, or offer to buy or sell any securities, franchises, or other financial instruments, particularly in jurisdictions where such activity would be unlawful.
All content is of a general nature and may not address the specific circumstances of any individual or entity. It is not a substitute for professional advice or services. Any actions you take based on the information provided here are strictly at your own risk. You accept full responsibility for any decisions or outcomes arising from your use of this website and agree to release us from any liability in connection with your use of, or reliance upon, the content or products found herein.