
|
Venustech Group Inc. (002439.SZ) Évaluation DCF |
Entièrement Modifiable: Adapté À Vos Besoins Dans Excel Ou Sheets
Conception Professionnelle: Modèles Fiables Et Conformes Aux Normes Du Secteur
Pré-Construits Pour Une Utilisation Rapide Et Efficace
Compatible MAC/PC, entièrement débloqué
Aucune Expertise N'Est Requise; Facile À Suivre
Venustech Group Inc. (002439.SZ) Bundle
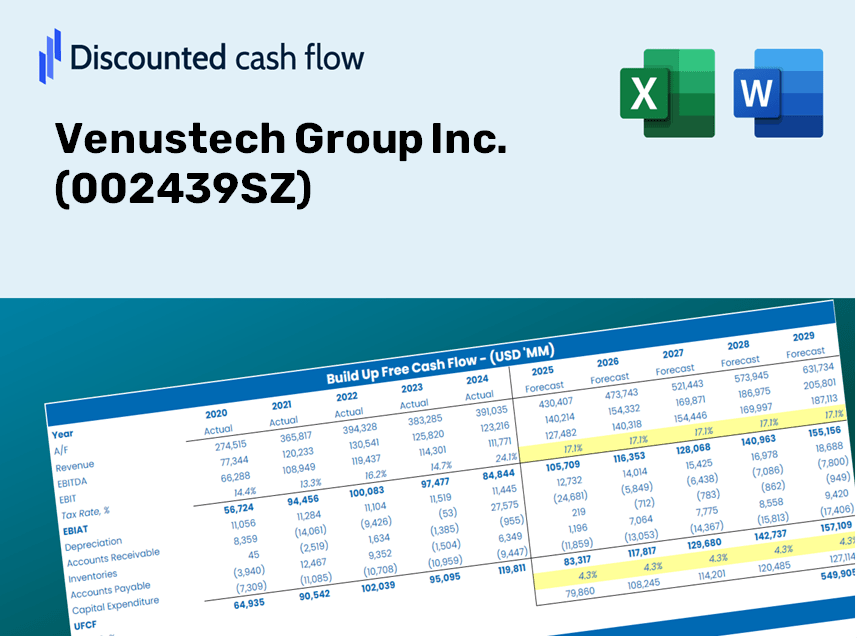
Conçu pour la précision, notre calculatrice DCF (002439SZ) vous permet d'évaluer l'évaluation de Venustech Group Inc. à l'aide de données financières du monde réel tout en offrant une flexibilité complète pour modifier tous les paramètres essentiels pour des projections améliorées.
Discounted Cash Flow (DCF) - (USD MM)
| Year | AY1 2020 |
AY2 2021 |
AY3 2022 |
AY4 2023 |
AY5 2024 |
FY1 2025 |
FY2 2026 |
FY3 2027 |
FY4 2028 |
FY5 2029 |
|---|---|---|---|---|---|---|---|---|---|---|
| Revenue | 3,646.7 | 4,386.0 | 4,436.9 | 4,506.9 | 3,315.2 | 3,286.7 | 3,258.5 | 3,230.6 | 3,202.8 | 3,175.4 |
| Revenue Growth, % | 0 | 20.27 | 1.16 | 1.58 | -26.44 | -0.85809 | -0.85809 | -0.85809 | -0.85809 | -0.85809 |
| EBITDA | 885.7 | 928.3 | 652.2 | 575.4 | -229.6 | 433.8 | 430.1 | 426.4 | 422.7 | 419.1 |
| EBITDA, % | 24.29 | 21.17 | 14.7 | 12.77 | -6.93 | 13.2 | 13.2 | 13.2 | 13.2 | 13.2 |
| Depreciation | 116.1 | 135.2 | 153.1 | 158.0 | 70.9 | 101.0 | 100.1 | 99.3 | 98.4 | 97.6 |
| Depreciation, % | 3.18 | 3.08 | 3.45 | 3.51 | 2.14 | 3.07 | 3.07 | 3.07 | 3.07 | 3.07 |
| EBIT | 769.6 | 793.1 | 499.1 | 417.4 | -300.5 | 332.8 | 330.0 | 327.1 | 324.3 | 321.5 |
| EBIT, % | 21.1 | 18.08 | 11.25 | 9.26 | -9.07 | 10.13 | 10.13 | 10.13 | 10.13 | 10.13 |
| Total Cash | 3,020.4 | 2,757.6 | 2,793.7 | 6,079.7 | 2,540.1 | 2,532.6 | 2,510.9 | 2,489.4 | 2,468.0 | 2,446.8 |
| Total Cash, percent | .0 | .0 | .0 | .0 | .0 | .0 | .0 | .0 | .0 | .0 |
| Account Receivables | 2,820.0 | 3,252.5 | 4,070.6 | 5,223.8 | 4,975.3 | 2,913.5 | 2,888.5 | 2,863.7 | 2,839.2 | 2,814.8 |
| Account Receivables, % | 77.33 | 74.16 | 91.74 | 115.91 | 150.08 | 88.65 | 88.65 | 88.65 | 88.65 | 88.65 |
| Inventories | 372.3 | 474.2 | 447.7 | 485.2 | 463.0 | 367.1 | 363.9 | 360.8 | 357.7 | 354.6 |
| Inventories, % | 10.21 | 10.81 | 10.09 | 10.77 | 13.97 | 11.17 | 11.17 | 11.17 | 11.17 | 11.17 |
| Accounts Payable | 1,126.1 | 885.5 | 1,162.0 | 1,429.3 | 1,182.1 | 950.7 | 942.6 | 934.5 | 926.4 | 918.5 |
| Accounts Payable, % | 30.88 | 20.19 | 26.19 | 31.71 | 35.66 | 28.93 | 28.93 | 28.93 | 28.93 | 28.93 |
| Capital Expenditure | -229.6 | -460.3 | -236.6 | -158.9 | -266.1 | -221.3 | -219.4 | -217.6 | -215.7 | -213.8 |
| Capital Expenditure, % | -6.29 | -10.49 | -5.33 | -3.53 | -8.03 | -6.73 | -6.73 | -6.73 | -6.73 | -6.73 |
| Tax Rate, % | 28.97 | 28.97 | 28.97 | 28.97 | 28.97 | 28.97 | 28.97 | 28.97 | 28.97 | 28.97 |
| EBITAT | 687.1 | 728.3 | 484.3 | 405.9 | -213.5 | 297.2 | 294.6 | 292.1 | 289.6 | 287.1 |
| Depreciation | ||||||||||
| Changes in Account Receivables | ||||||||||
| Changes in Inventories | ||||||||||
| Changes in Accounts Payable | ||||||||||
| Capital Expenditure | ||||||||||
| UFCF | -1,492.4 | -371.8 | -114.2 | -518.5 | -385.1 | 2,103.1 | 195.3 | 193.6 | 191.9 | 190.3 |
| WACC, % | 5.03 | 5.03 | 5.03 | 5.03 | 5.03 | 5.03 | 5.03 | 5.03 | 5.03 | 5.03 |
| PV UFCF | ||||||||||
| SUM PV UFCF | 2,652.9 | |||||||||
| Long Term Growth Rate, % | 4.00 | |||||||||
| Free cash flow (T + 1) | 198 | |||||||||
| Terminal Value | 19,146 | |||||||||
| Present Terminal Value | 14,977 | |||||||||
| Enterprise Value | 17,630 | |||||||||
| Net Debt | -1,947 | |||||||||
| Equity Value | 19,577 | |||||||||
| Diluted Shares Outstanding, MM | 1,191 | |||||||||
| Equity Value Per Share | 16.44 |
What You Will Receive
- Authentic Venustech Data: Comprehensive financials – encompassing revenue through EBIT – based on real and projected figures.
- Complete Customization: Modify all essential parameters (yellow cells) such as WACC, growth %, and tax rates.
- Immediate Valuation Adjustments: Automatic recalculations to assess the effects of changes on Venustech Group’s fair value.
- Flexible Excel Template: Designed for easy modifications, scenario analysis, and in-depth forecasting.
- Efficient and Precise: Avoid starting models from scratch while ensuring accuracy and adaptability.
Key Features
- Authentic VST Data: Pre-loaded with Venustech Group Inc.’s historical financial figures and future projections.
- Completely Customizable Inputs: Tailor revenue growth, profit margins, WACC, tax rates, and capital expenditures to your preferences.
- Adaptive Valuation Model: Automatic recalculations of Net Present Value (NPV) and intrinsic value in response to your inputs.
- Scenario Analysis: Develop various forecasting scenarios to explore different valuation results.
- Intuitive User Interface: Designed to be straightforward and accessible for both seasoned professionals and newcomers.
How It Works
- Step 1: Download the Excel file.
- Step 2: Review Venustech Group Inc.'s pre-filled financial data and forecasts.
- Step 3: Adjust key inputs such as revenue growth, WACC, and tax rates (highlighted cells).
- Step 4: Observe the DCF model update in real-time as you modify your assumptions.
- Step 5: Evaluate the outputs and leverage the results for your investment strategies.
Why Opt for Venustech Group Inc. ([002439SZ]) Calculator?
- Time-Saving: Skip the hassle of building a DCF model from scratch – it’s ready for immediate use.
- Enhanced Accuracy: Dependable financial data and formulas help minimize valuation errors.
- Completely Customizable: Adjust the model to align with your specific assumptions and forecasts.
- User-Friendly: Intuitive charts and outputs make analyzing results straightforward.
- Endorsed by Professionals: Crafted for experts who prioritize precision and ease of use.
Who Can Benefit from This Product?
- Institutional Investors: Create comprehensive and accurate valuation models for enhanced portfolio assessments.
- Corporate Finance Departments: Evaluate valuation scenarios to inform strategic decisions within the organization.
- Financial Consultants and Advisors: Equip clients with precise valuation insights for Venustech Group Inc. (002439SZ).
- Academics and Students: Leverage real-world data for practicing and teaching financial modeling techniques.
- Technology Advocates: Gain insights into how technology firms like Venustech Group Inc. (002439SZ) are valued in the marketplace.
Overview of the Template Contents
- Historical Data: Contains Venustech Group Inc.'s past financial records and foundational forecasts.
- DCF and Levered DCF Models: Comprehensive templates designed to assess the intrinsic value of Venustech Group Inc. (002439SZ).
- WACC Sheet: Built-in calculations for the Weighted Average Cost of Capital.
- Editable Inputs: Adjust essential parameters such as growth rates, EBITDA %, and CAPEX estimates.
- Quarterly and Annual Statements: An extensive analysis of Venustech Group Inc.'s financial performance.
- Interactive Dashboard: Dynamically visualize valuation outcomes and forecasts.
Disclaimer
All information, articles, and product details provided on this website are for general informational and educational purposes only. We do not claim any ownership over, nor do we intend to infringe upon, any trademarks, copyrights, logos, brand names, or other intellectual property mentioned or depicted on this site. Such intellectual property remains the property of its respective owners, and any references here are made solely for identification or informational purposes, without implying any affiliation, endorsement, or partnership.
We make no representations or warranties, express or implied, regarding the accuracy, completeness, or suitability of any content or products presented. Nothing on this website should be construed as legal, tax, investment, financial, medical, or other professional advice. In addition, no part of this site—including articles or product references—constitutes a solicitation, recommendation, endorsement, advertisement, or offer to buy or sell any securities, franchises, or other financial instruments, particularly in jurisdictions where such activity would be unlawful.
All content is of a general nature and may not address the specific circumstances of any individual or entity. It is not a substitute for professional advice or services. Any actions you take based on the information provided here are strictly at your own risk. You accept full responsibility for any decisions or outcomes arising from your use of this website and agree to release us from any liability in connection with your use of, or reliance upon, the content or products found herein.