
|
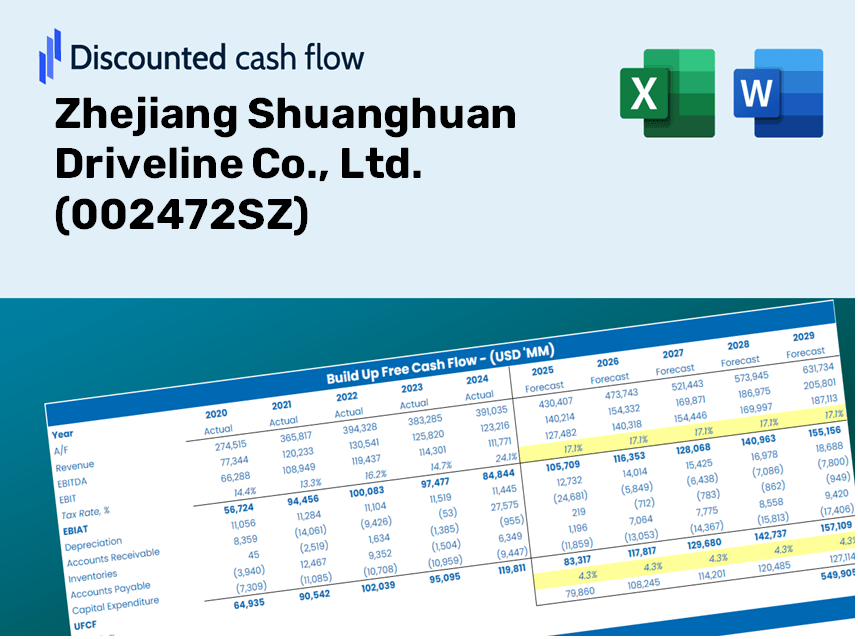
Zhejiang Shuanghuan Driveline Co., Ltd. (002472.sz) Valation DCF |
Entièrement Modifiable: Adapté À Vos Besoins Dans Excel Ou Sheets
Conception Professionnelle: Modèles Fiables Et Conformes Aux Normes Du Secteur
Pré-Construits Pour Une Utilisation Rapide Et Efficace
Compatible MAC/PC, entièrement débloqué
Aucune Expertise N'Est Requise; Facile À Suivre
Zhejiang Shuanghuan Driveline Co., Ltd. (002472.SZ) Bundle
Explorez l'avenir financier de Zhejiang Shuanghuan Driveline Co., Ltd. (002472SZ) avec notre calculatrice DCF conviviale! Entrez vos hypothèses concernant la croissance, les marges et les coûts pour calculer la valeur intrinsèque de Zhejiang Shuanghuan Driveline Co., Ltd. (002472SZ) et façonnez votre stratégie d'investissement.
Benefits You Will Receive
- Genuine Zhejiang Shuanghuan Data: Comprehensive financials – encompassing revenue to EBIT – based on real and projected metrics.
- Complete Customization: Modify all essential parameters (yellow cells) such as WACC, growth %, and tax rates.
- Immediate Valuation Updates: Automatic recalculations to assess the effects of changes on [Symbol]’s fair value.
- Flexible Excel Template: Designed for quick modifications, scenario analysis, and detailed forecasts.
- Efficient and Precise: Avoid the hassle of building models from the ground up while ensuring accuracy and adaptability.
Feature Highlights
- Comprehensive Financial Data: Gain access to precise historical performance and future forecasts for Zhejiang Shuanghuan Driveline Co., Ltd. (002472SZ).
- Adjustable Forecast Parameters: Modify highlighted fields such as WACC, growth rates, and profit margins to fit your analysis.
- Real-Time Calculations: Automatic recalculations for DCF, Net Present Value (NPV), and cash flow evaluations.
- User-Friendly Dashboard: Intuitive charts and summaries to easily interpret your valuation findings.
- Suitable for All Skill Levels: Designed to accommodate both seasoned investors and newcomers, making it ideal for CFOs, consultants, and analysts.
How It Works
- Step 1: Download the Excel file.
- Step 2: Review the pre-filled Zhejiang Shuanghuan Driveline Co., Ltd. (002472SZ) data (historical and projected).
- Step 3: Modify key assumptions (highlighted in yellow) according to your analysis.
- Step 4: Observe automatic recalculations of Zhejiang Shuanghuan Driveline Co., Ltd. (002472SZ)'s intrinsic value.
- Step 5: Utilize the results for your investment decisions or reporting needs.
Why Choose This Tool for Zhejiang Shuanghuan Driveline Co., Ltd. (002472SZ)?
- Designed for Industry Experts: A sophisticated instrument tailored for analysts, financial officers, and consultants.
- Accurate Financial Data: Historical and projected financials specific to Zhejiang Shuanghuan Driveline Co., Ltd. preloaded for precision.
- Flexible Scenario Analysis: Easily test various forecasts and underlying assumptions.
- Comprehensive Outputs: Automatically computes intrinsic value, NPV, and essential metrics.
- User-Friendly Interface: Step-by-step guidance simplifies your financial analysis process.
Who Can Benefit from This Product?
- Investors: Assess the valuation of Zhejiang Shuanghuan Driveline Co., Ltd. (002472SZ) prior to making stock transactions.
- CFOs and Financial Analysts: Enhance efficiency in valuation processes and evaluate financial projections.
- Startup Founders: Gain insights into the valuation methods utilized by prominent companies like Zhejiang Shuanghuan Driveline Co., Ltd. (002472SZ).
- Consultants: Create detailed valuation reports for your clients based on the performance of Zhejiang Shuanghuan Driveline Co., Ltd. (002472SZ).
- Students and Educators: Utilize real-time data to practice and instruct valuation strategies.
What the Template Contains
- Pre-Filled DCF Model: Financial data for Zhejiang Shuanghuan Driveline Co., Ltd. (002472SZ) preloaded for immediate use.
- WACC Calculator: Comprehensive calculations for Weighted Average Cost of Capital.
- Financial Ratios: Analyze Zhejiang Shuanghuan's profitability, leverage, and operational efficiency.
- Editable Inputs: Adjust assumptions like growth rates, profit margins, and capital expenditures to fit your scenarios.
- Financial Statements: Access to annual and quarterly reports for in-depth analysis.
- Interactive Dashboard: Effortlessly visualize essential valuation metrics and outcomes.
Disclaimer
All information, articles, and product details provided on this website are for general informational and educational purposes only. We do not claim any ownership over, nor do we intend to infringe upon, any trademarks, copyrights, logos, brand names, or other intellectual property mentioned or depicted on this site. Such intellectual property remains the property of its respective owners, and any references here are made solely for identification or informational purposes, without implying any affiliation, endorsement, or partnership.
We make no representations or warranties, express or implied, regarding the accuracy, completeness, or suitability of any content or products presented. Nothing on this website should be construed as legal, tax, investment, financial, medical, or other professional advice. In addition, no part of this site—including articles or product references—constitutes a solicitation, recommendation, endorsement, advertisement, or offer to buy or sell any securities, franchises, or other financial instruments, particularly in jurisdictions where such activity would be unlawful.
All content is of a general nature and may not address the specific circumstances of any individual or entity. It is not a substitute for professional advice or services. Any actions you take based on the information provided here are strictly at your own risk. You accept full responsibility for any decisions or outcomes arising from your use of this website and agree to release us from any liability in connection with your use of, or reliance upon, the content or products found herein.