
|
Tongding Interconnection Information Co., Ltd. (002491.SZ) Évaluation DCF |
Entièrement Modifiable: Adapté À Vos Besoins Dans Excel Ou Sheets
Conception Professionnelle: Modèles Fiables Et Conformes Aux Normes Du Secteur
Pré-Construits Pour Une Utilisation Rapide Et Efficace
Compatible MAC/PC, entièrement débloqué
Aucune Expertise N'Est Requise; Facile À Suivre
Tongding Interconnection Information Co., Ltd. (002491.SZ) Bundle
Découvrez le véritable potentiel de Tongding Interconnection Information Co., Ltd. (002491SZ) avec notre calculatrice avancée DCF! Ajustez les hypothèses essentielles, explorez divers scénarios et évaluez comment les différents facteurs influencent l'évaluation de Tongding Interconnection Information Co., Ltd. (002491SZ) - le tout dans un seul modèle Excel.
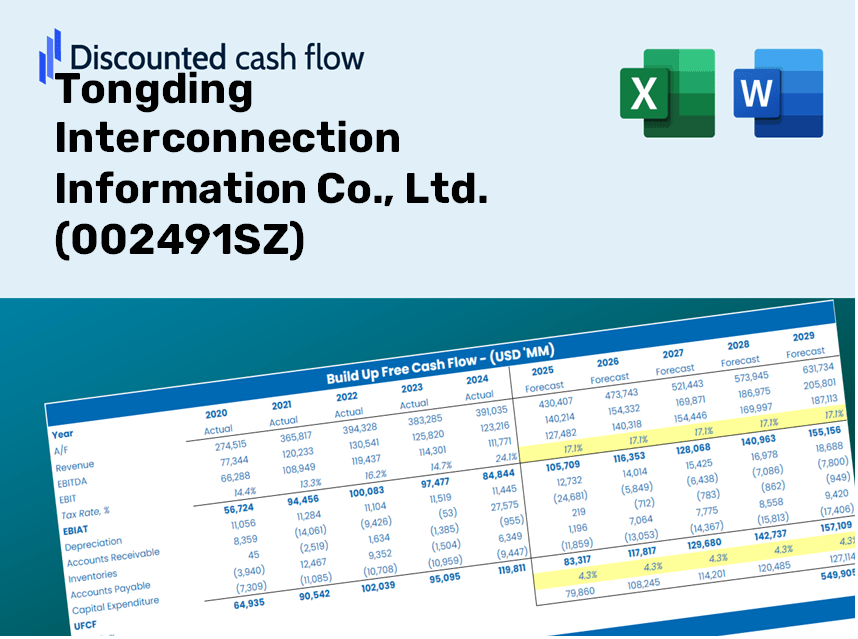
Discounted Cash Flow (DCF) - (USD MM)
| Year | AY1 2020 |
AY2 2021 |
AY3 2022 |
AY4 2023 |
AY5 2024 |
FY1 2025 |
FY2 2026 |
FY3 2027 |
FY4 2028 |
FY5 2029 |
|---|---|---|---|---|---|---|---|---|---|---|
| Revenue | 3,586.5 | 2,977.3 | 3,315.9 | 3,348.9 | 2,915.1 | 2,787.0 | 2,664.6 | 2,547.6 | 2,435.7 | 2,328.7 |
| Revenue Growth, % | 0 | -16.99 | 11.37 | 0.99658 | -12.95 | -4.39 | -4.39 | -4.39 | -4.39 | -4.39 |
| EBITDA | 531.8 | -170.1 | 421.7 | 568.1 | 197.1 | 253.9 | 242.8 | 232.1 | 221.9 | 212.2 |
| EBITDA, % | 14.83 | -5.71 | 12.72 | 16.96 | 6.76 | 9.11 | 9.11 | 9.11 | 9.11 | 9.11 |
| Depreciation | 188.9 | 212.5 | 134.3 | 133.9 | 90.6 | 131.3 | 125.6 | 120.0 | 114.8 | 109.7 |
| Depreciation, % | 5.27 | 7.14 | 4.05 | 4 | 3.11 | 4.71 | 4.71 | 4.71 | 4.71 | 4.71 |
| EBIT | 343.0 | -382.6 | 287.4 | 434.2 | 106.4 | 122.6 | 117.2 | 112.1 | 107.2 | 102.4 |
| EBIT, % | 9.56 | -12.85 | 8.67 | 12.97 | 3.65 | 4.4 | 4.4 | 4.4 | 4.4 | 4.4 |
| Total Cash | 1,931.6 | 1,347.6 | 1,629.7 | 1,643.5 | 1,276.4 | 1,344.1 | 1,285.0 | 1,228.6 | 1,174.6 | 1,123.0 |
| Total Cash, percent | .0 | .0 | .0 | .0 | .0 | .0 | .0 | .0 | .0 | .0 |
| Account Receivables | 1,525.2 | 1,254.9 | 1,216.7 | 1,384.4 | 1,418.1 | 1,178.1 | 1,126.4 | 1,076.9 | 1,029.6 | 984.3 |
| Account Receivables, % | 42.53 | 42.15 | 36.69 | 41.34 | 48.65 | 42.27 | 42.27 | 42.27 | 42.27 | 42.27 |
| Inventories | 944.9 | 922.8 | 878.2 | 822.4 | 818.3 | 760.6 | 727.2 | 695.3 | 664.7 | 635.5 |
| Inventories, % | 26.35 | 31 | 26.49 | 24.56 | 28.07 | 27.29 | 27.29 | 27.29 | 27.29 | 27.29 |
| Accounts Payable | 950.5 | 589.7 | 1,189.9 | 1,157.4 | 846.5 | 812.7 | 777.0 | 742.8 | 710.2 | 679.0 |
| Accounts Payable, % | 26.5 | 19.81 | 35.88 | 34.56 | 29.04 | 29.16 | 29.16 | 29.16 | 29.16 | 29.16 |
| Capital Expenditure | -120.2 | -101.0 | -31.5 | -32.0 | -32.4 | -54.4 | -52.0 | -49.7 | -47.5 | -45.5 |
| Capital Expenditure, % | -3.35 | -3.39 | -0.95069 | -0.95422 | -1.11 | -1.95 | -1.95 | -1.95 | -1.95 | -1.95 |
| Tax Rate, % | -178.51 | -178.51 | -178.51 | -178.51 | -178.51 | -178.51 | -178.51 | -178.51 | -178.51 | -178.51 |
| EBITAT | 175.6 | -401.2 | 233.3 | 343.3 | 296.4 | 100.9 | 96.5 | 92.2 | 88.2 | 84.3 |
| Depreciation | ||||||||||
| Changes in Account Receivables | ||||||||||
| Changes in Inventories | ||||||||||
| Changes in Accounts Payable | ||||||||||
| Capital Expenditure | ||||||||||
| UFCF | -1,275.3 | -358.1 | 1,018.9 | 301.0 | 14.1 | 441.7 | 219.5 | 209.8 | 200.6 | 191.8 |
| WACC, % | 4.32 | 4.97 | 4.72 | 4.69 | 4.97 | 4.73 | 4.73 | 4.73 | 4.73 | 4.73 |
| PV UFCF | ||||||||||
| SUM PV UFCF | 1,123.4 | |||||||||
| Long Term Growth Rate, % | 2.00 | |||||||||
| Free cash flow (T + 1) | 196 | |||||||||
| Terminal Value | 7,154 | |||||||||
| Present Terminal Value | 5,676 | |||||||||
| Enterprise Value | 6,800 | |||||||||
| Net Debt | 687 | |||||||||
| Equity Value | 6,113 | |||||||||
| Diluted Shares Outstanding, MM | 1,229 | |||||||||
| Equity Value Per Share | 4.97 |
What You Will Receive
- Genuine Tongding Financials: Access to both historical performance and projected data for precise valuation.
- Customizable Inputs: Adjust parameters such as WACC, tax rates, revenue growth, and capital expenditures.
- Automated Calculations: Intrinsic value and NPV are computed in real-time.
- Scenario Analysis: Explore various scenarios to assess the future outlook of Tongding Interconnection (002491SZ).
- User-Friendly Design: Designed for professionals while remaining user-friendly for newcomers.
Key Features
- Comprehensive DCF Calculator: Offers intricate unlevered and levered DCF valuation models tailored for Tongding Interconnection Information Co., Ltd. (002491SZ).
- WACC Estimator: Pre-configured Weighted Average Cost of Capital sheet with options for personalized inputs.
- Customizable Forecast Assumptions: Adjust growth projections, capital investments, and discount rates to suit analysis needs.
- Integrated Financial Ratios: Evaluate profitability, leverage, and efficiency ratios specific to Tongding Interconnection Information Co., Ltd. (002491SZ).
- Interactive Dashboard and Visuals: Graphical representations that summarize essential valuation metrics for straightforward interpretation.
How It Works
- Step 1: Download the Excel file for Tongding Interconnection Information Co., Ltd. (002491SZ).
- Step 2: Examine the pre-filled financial data and forecasts for Tongding.
- Step 3: Adjust key inputs such as revenue growth, WACC, and tax rates (highlighted cells).
- Step 4: Observe the DCF model update in real-time as you adjust your assumptions.
- Step 5: Evaluate the outputs and leverage the results to inform your investment decisions.
Why Choose This Calculator for Tongding Interconnection Information Co., Ltd. (002491SZ)?
- Precise Data: Access to real Tongding financials guarantees trustworthy valuation outcomes.
- Fully Customizable: Modify essential parameters such as growth rates, WACC, and tax rates to align with your forecasts.
- Efficiency: Built-in calculations save you the effort of starting from the ground up.
- Professional-Grade Resource: Tailored for investors, analysts, and consultants in the field.
- Easy to Use: User-friendly design and guided instructions make it accessible for everyone.
Who Should Use This Product?
- Professional Investors: Create comprehensive and trustworthy valuation models for analyzing portfolios involving Tongding Interconnection Information Co., Ltd. (002491SZ).
- Corporate Finance Teams: Evaluate valuation scenarios to inform strategic decisions within their organizations.
- Consultants and Advisors: Deliver precise valuation insights for clients interested in Tongding Interconnection Information Co., Ltd. (002491SZ).
- Students and Educators: Utilize real-world data for practicing and teaching financial modeling techniques.
- Tech Enthusiasts: Gain insights into how tech companies like Tongding Interconnection Information Co., Ltd. (002491SZ) are valued in the market.
Contents of the Template
- Preloaded Tongding Data: Historical and projected financial figures, including revenue, EBIT, and capital expenditures.
- DCF and WACC Models: Expert-level sheets designed for calculating intrinsic value and the Weighted Average Cost of Capital.
- Editable Inputs: Cells highlighted in yellow for modifying revenue growth, tax rates, and discount rates.
- Financial Statements: Detailed annual and quarterly financials for in-depth analysis.
- Key Ratios: Ratios related to profitability, leverage, and efficiency to assess performance.
- Dashboard and Charts: Visual representations of valuation results and underlying assumptions.
Disclaimer
All information, articles, and product details provided on this website are for general informational and educational purposes only. We do not claim any ownership over, nor do we intend to infringe upon, any trademarks, copyrights, logos, brand names, or other intellectual property mentioned or depicted on this site. Such intellectual property remains the property of its respective owners, and any references here are made solely for identification or informational purposes, without implying any affiliation, endorsement, or partnership.
We make no representations or warranties, express or implied, regarding the accuracy, completeness, or suitability of any content or products presented. Nothing on this website should be construed as legal, tax, investment, financial, medical, or other professional advice. In addition, no part of this site—including articles or product references—constitutes a solicitation, recommendation, endorsement, advertisement, or offer to buy or sell any securities, franchises, or other financial instruments, particularly in jurisdictions where such activity would be unlawful.
All content is of a general nature and may not address the specific circumstances of any individual or entity. It is not a substitute for professional advice or services. Any actions you take based on the information provided here are strictly at your own risk. You accept full responsibility for any decisions or outcomes arising from your use of this website and agree to release us from any liability in connection with your use of, or reliance upon, the content or products found herein.