
|
Stanley Agriculture Group Co., Ltd. (002588.SZ) Évaluation DCF |
Entièrement Modifiable: Adapté À Vos Besoins Dans Excel Ou Sheets
Conception Professionnelle: Modèles Fiables Et Conformes Aux Normes Du Secteur
Pré-Construits Pour Une Utilisation Rapide Et Efficace
Compatible MAC/PC, entièrement débloqué
Aucune Expertise N'Est Requise; Facile À Suivre
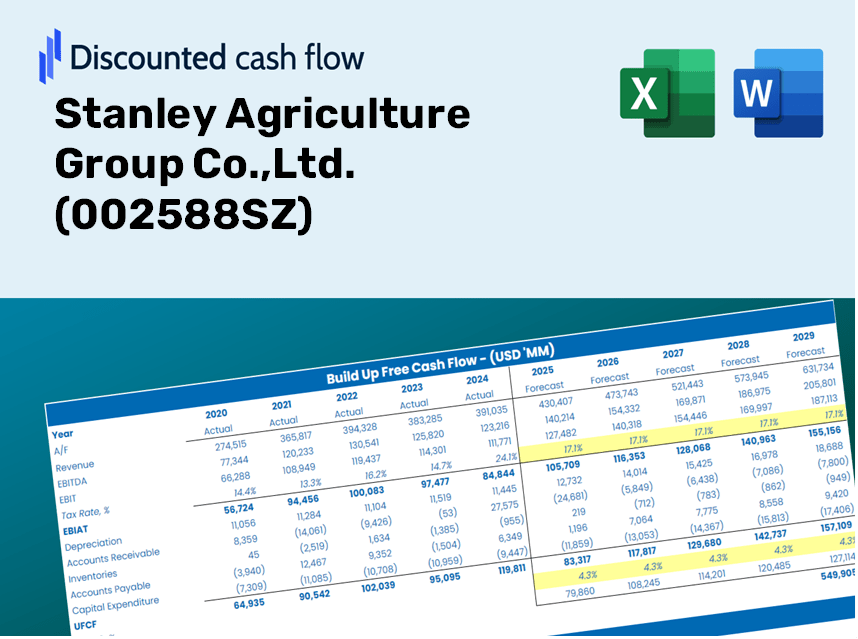
Stanley Agriculture Group Co.,Ltd. (002588.SZ) Bundle
Que vous soyez un investisseur ou un analyste, cette calculatrice DCF (002588SZ) est votre ressource incontournable pour une évaluation précise. Doté de données réelles de Stanley Agriculture Group Co., Ltd., vous pouvez ajuster les prévisions et observer instantanément les effets.
Discounted Cash Flow (DCF) - (USD MM)
| Year | AY1 2020 |
AY2 2021 |
AY3 2022 |
AY4 2023 |
AY5 2024 |
FY1 2025 |
FY2 2026 |
FY3 2027 |
FY4 2028 |
FY5 2029 |
|---|---|---|---|---|---|---|---|---|---|---|
| Revenue | 6,187.9 | 6,436.0 | 9,038.3 | 9,991.3 | 10,262.5 | 9,607.3 | 8,993.8 | 8,419.6 | 7,882.0 | 7,378.7 |
| Revenue Growth, % | 0 | 4.01 | 40.43 | 10.54 | 2.71 | -6.38 | -6.38 | -6.38 | -6.38 | -6.38 |
| EBITDA | 542.0 | 536.2 | 498.0 | 791.5 | 939.0 | 762.3 | 713.6 | 668.0 | 625.4 | 585.5 |
| EBITDA, % | 8.76 | 8.33 | 5.51 | 7.92 | 9.15 | 7.93 | 7.93 | 7.93 | 7.93 | 7.93 |
| Depreciation | 204.1 | 209.8 | 219.4 | 228.8 | 302.9 | 273.4 | 255.9 | 239.6 | 224.3 | 210.0 |
| Depreciation, % | 3.3 | 3.26 | 2.43 | 2.29 | 2.95 | 2.85 | 2.85 | 2.85 | 2.85 | 2.85 |
| EBIT | 337.9 | 326.4 | 278.7 | 562.7 | 636.1 | 488.9 | 457.7 | 428.5 | 401.1 | 375.5 |
| EBIT, % | 5.46 | 5.07 | 3.08 | 5.63 | 6.2 | 5.09 | 5.09 | 5.09 | 5.09 | 5.09 |
| Total Cash | 2,935.9 | 3,006.5 | 4,030.8 | 3,231.1 | 2,572.8 | 3,769.2 | 3,528.6 | 3,303.3 | 3,092.4 | 2,894.9 |
| Total Cash, percent | .0 | .0 | .0 | .0 | .0 | .0 | .0 | .0 | .0 | .0 |
| Account Receivables | 62.7 | 119.2 | 69.5 | 5.4 | 29.7 | 76.4 | 71.5 | 67.0 | 62.7 | 58.7 |
| Account Receivables, % | 1.01 | 1.85 | 0.76894 | 0.05412923 | 0.28902 | 0.79526 | 0.79526 | 0.79526 | 0.79526 | 0.79526 |
| Inventories | 878.9 | 1,411.8 | 1,242.3 | 1,553.0 | 2,020.2 | 1,635.4 | 1,531.0 | 1,433.2 | 1,341.7 | 1,256.1 |
| Inventories, % | 14.2 | 21.94 | 13.74 | 15.54 | 19.69 | 17.02 | 17.02 | 17.02 | 17.02 | 17.02 |
| Accounts Payable | 1,242.7 | 998.3 | 1,251.7 | 2,798.6 | 2,680.5 | 1,990.1 | 1,863.0 | 1,744.1 | 1,632.7 | 1,528.5 |
| Accounts Payable, % | 20.08 | 15.51 | 13.85 | 28.01 | 26.12 | 20.71 | 20.71 | 20.71 | 20.71 | 20.71 |
| Capital Expenditure | -40.1 | -95.4 | -526.3 | -2,165.8 | -979.5 | -752.7 | -704.7 | -659.7 | -617.5 | -578.1 |
| Capital Expenditure, % | -0.64764 | -1.48 | -5.82 | -21.68 | -9.54 | -7.83 | -7.83 | -7.83 | -7.83 | -7.83 |
| Tax Rate, % | 9.72 | 9.72 | 9.72 | 9.72 | 9.72 | 9.72 | 9.72 | 9.72 | 9.72 | 9.72 |
| EBITAT | 316.2 | 287.4 | 246.4 | 478.8 | 574.3 | 435.6 | 407.8 | 381.7 | 357.3 | 334.5 |
| Depreciation | ||||||||||
| Changes in Account Receivables | ||||||||||
| Changes in Inventories | ||||||||||
| Changes in Accounts Payable | ||||||||||
| Capital Expenditure | ||||||||||
| UFCF | 781.4 | -432.0 | 412.0 | -158.0 | -711.7 | -396.1 | -58.8 | -55.0 | -51.5 | -48.2 |
| WACC, % | 5.8 | 5.78 | 5.78 | 5.77 | 5.79 | 5.78 | 5.78 | 5.78 | 5.78 | 5.78 |
| PV UFCF | ||||||||||
| SUM PV UFCF | -551.0 | |||||||||
| Long Term Growth Rate, % | 2.00 | |||||||||
| Free cash flow (T + 1) | -49 | |||||||||
| Terminal Value | -1,300 | |||||||||
| Present Terminal Value | -981 | |||||||||
| Enterprise Value | -1,532 | |||||||||
| Net Debt | -51 | |||||||||
| Equity Value | -1,482 | |||||||||
| Diluted Shares Outstanding, MM | 1,147 | |||||||||
| Equity Value Per Share | -1.29 |
Benefits You'll Enjoy
- Genuine Stanley Ag Financials: Access both historical and projected data for precise valuation insights.
- Customizable Parameters: Adjust WACC, tax rates, revenue growth, and capital expenditures as needed.
- Instant Calculations: Intrinsic value and NPV are computed in real-time.
- Scenario Exploration: Analyze various scenarios to assess the future performance of Stanley Agriculture Group Co.,Ltd. (002588SZ).
- User-Friendly Interface: Designed for experts while remaining easy to navigate for newcomers.
Key Features of Stanley Agriculture Group Co., Ltd. (002588SZ)
- Comprehensive DCF Calculator: Offers detailed unlevered and levered DCF valuation models tailored for agricultural investments.
- WACC Calculator: Features a pre-configured Weighted Average Cost of Capital sheet with adjustable parameters.
- Customizable Forecast Assumptions: Easily alter growth rates, capital expenditures, and discount rates to suit specific analyses.
- Integrated Financial Ratios: Evaluate profitability, leverage, and efficiency ratios specific to Stanley Agriculture Group Co., Ltd.
- Interactive Dashboard and Charts: Visual representations that highlight essential valuation metrics for straightforward evaluation.
How It Works
- Step 1: Download the Excel file for Stanley Agriculture Group Co.,Ltd. (002588SZ).
- Step 2: Review the pre-filled financial data and forecasts for Stanley Agriculture Group.
- Step 3: Adjust key inputs such as revenue growth, WACC, and tax rates (cells marked for your convenience).
- Step 4: Observe the DCF model refresh in real-time as you modify your assumptions.
- Step 5: Evaluate the results and leverage the insights for your investment strategies.
Why Choose Stanley Agriculture Group Co., Ltd. (002588SZ)?
- Reliable Insights: Utilizes real financial data to deliver trustworthy valuation outcomes.
- Flexible Options: Customize essential inputs like growth projections, discount rates, and tax considerations to align with your forecasts.
- Efficiency: Built-in calculations save you time and effort, allowing you to focus on analysis.
- Expert-Level Tool: Tailored for investors, analysts, and agricultural consultants.
- Easy to Use: Designed with a clear layout and straightforward instructions for all skill levels.
Who Should Benefit from This Product?
- Agricultural Investors: Develop comprehensive and accurate valuation models for analyzing portfolio performance.
- Corporate Finance Departments: Assess valuation scenarios to shape strategic direction within the company.
- Consultants and Advisors: Deliver precise valuation insights for Stanley Agriculture Group Co.,Ltd. (002588SZ) to clients.
- Students and Instructors: Utilize real-world data to enhance learning and practice in financial modeling.
- Agriculture Industry Enthusiasts: Gain insights into how companies like Stanley Agriculture Group Co.,Ltd. (002588SZ) are valued in the marketplace.
Contents of the Template
- Operating and Balance Sheet Data: Pre-filled historical data and forecasts for Stanley Agriculture Group Co., Ltd. (002588SZ), including revenue, EBITDA, EBIT, and capital expenditures.
- WACC Calculation: A dedicated sheet for the Weighted Average Cost of Capital (WACC), encompassing key parameters such as Beta, risk-free rate, and share price.
- DCF Valuation (Unlevered and Levered): Customizable Discounted Cash Flow models providing intrinsic value assessments with comprehensive calculations.
- Financial Statements: Pre-loaded annual and quarterly financial statements to facilitate in-depth analysis.
- Key Ratios: A collection of profitability, leverage, and efficiency ratios specific to Stanley Agriculture Group Co., Ltd. (002588SZ).
- Dashboard and Charts: A visual summary of valuation outputs and assumptions for streamlined result analysis.
Disclaimer
All information, articles, and product details provided on this website are for general informational and educational purposes only. We do not claim any ownership over, nor do we intend to infringe upon, any trademarks, copyrights, logos, brand names, or other intellectual property mentioned or depicted on this site. Such intellectual property remains the property of its respective owners, and any references here are made solely for identification or informational purposes, without implying any affiliation, endorsement, or partnership.
We make no representations or warranties, express or implied, regarding the accuracy, completeness, or suitability of any content or products presented. Nothing on this website should be construed as legal, tax, investment, financial, medical, or other professional advice. In addition, no part of this site—including articles or product references—constitutes a solicitation, recommendation, endorsement, advertisement, or offer to buy or sell any securities, franchises, or other financial instruments, particularly in jurisdictions where such activity would be unlawful.
All content is of a general nature and may not address the specific circumstances of any individual or entity. It is not a substitute for professional advice or services. Any actions you take based on the information provided here are strictly at your own risk. You accept full responsibility for any decisions or outcomes arising from your use of this website and agree to release us from any liability in connection with your use of, or reliance upon, the content or products found herein.