
|
Beijing WKW Automotive Parts Co., Ltd. (0026622.SZ) Évaluation DCF |
Entièrement Modifiable: Adapté À Vos Besoins Dans Excel Ou Sheets
Conception Professionnelle: Modèles Fiables Et Conformes Aux Normes Du Secteur
Pré-Construits Pour Une Utilisation Rapide Et Efficace
Compatible MAC/PC, entièrement débloqué
Aucune Expertise N'Est Requise; Facile À Suivre
Beijing WKW Automotive Parts Co.,Ltd. (002662.SZ) Bundle
Découvrez la vraie valeur de Beijing WKW Automotive Parts Co., Ltd. avec notre calculatrice DCF de qualité professionnelle! Ajustez les hypothèses clés, explorez divers scénarios et évaluez comment les changements affectent l'évaluation de Beijing WKW Automotive Co., Ltd. - le tout dans un seul modèle Excel.
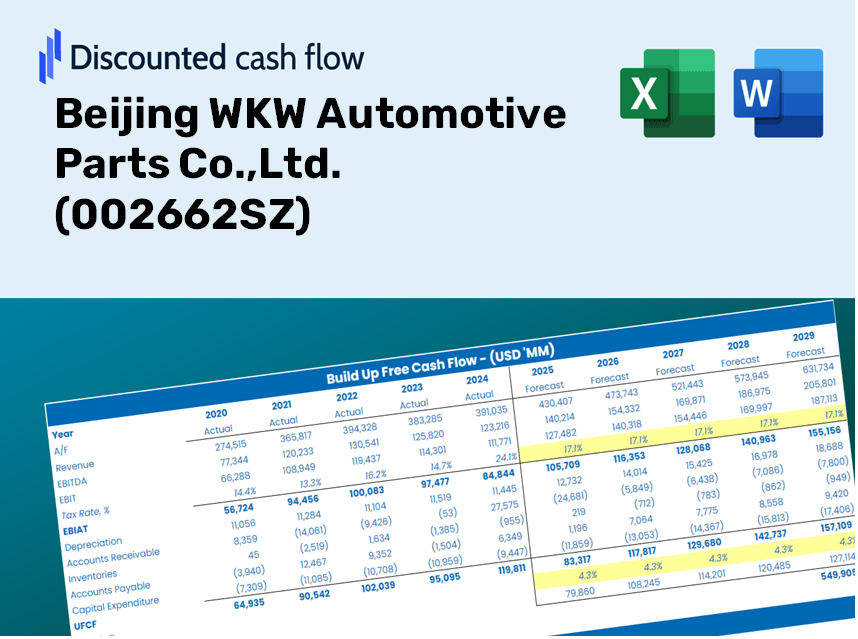
Discounted Cash Flow (DCF) - (USD MM)
| Year | AY1 2020 |
AY2 2021 |
AY3 2022 |
AY4 2023 |
AY5 2024 |
FY1 2025 |
FY2 2026 |
FY3 2027 |
FY4 2028 |
FY5 2029 |
|---|---|---|---|---|---|---|---|---|---|---|
| Revenue | 3,754.1 | 3,508.9 | 3,578.4 | 3,600.9 | 3,094.8 | 2,955.7 | 2,822.9 | 2,696.0 | 2,574.9 | 2,459.1 |
| Revenue Growth, % | 0 | -6.53 | 1.98 | 0.62879 | -14.06 | -4.49 | -4.49 | -4.49 | -4.49 | -4.49 |
| EBITDA | 568.0 | 465.5 | 767.8 | 840.7 | 675.2 | 561.7 | 536.4 | 512.3 | 489.3 | 467.3 |
| EBITDA, % | 15.13 | 13.27 | 21.46 | 23.35 | 21.82 | 19 | 19 | 19 | 19 | 19 |
| Depreciation | 272.2 | 265.7 | 247.7 | 250.8 | 262.2 | 219.8 | 209.9 | 200.5 | 191.5 | 182.9 |
| Depreciation, % | 7.25 | 7.57 | 6.92 | 6.96 | 8.47 | 7.44 | 7.44 | 7.44 | 7.44 | 7.44 |
| EBIT | 295.8 | 199.8 | 520.1 | 589.9 | 413.0 | 341.9 | 326.5 | 311.9 | 297.8 | 284.5 |
| EBIT, % | 7.88 | 5.7 | 14.53 | 16.38 | 13.35 | 11.57 | 11.57 | 11.57 | 11.57 | 11.57 |
| Total Cash | 437.4 | 243.8 | 356.7 | 480.2 | 952.5 | 429.6 | 410.3 | 391.9 | 374.3 | 357.5 |
| Total Cash, percent | .0 | .0 | .0 | .0 | .0 | .0 | .0 | .0 | .0 | .0 |
| Account Receivables | 1,218.2 | 981.5 | 992.4 | 1,061.0 | 812.3 | 850.5 | 812.2 | 775.7 | 740.9 | 707.6 |
| Account Receivables, % | 32.45 | 27.97 | 27.73 | 29.46 | 26.25 | 28.77 | 28.77 | 28.77 | 28.77 | 28.77 |
| Inventories | 606.0 | 712.3 | 644.1 | 534.4 | 458.8 | 497.2 | 474.9 | 453.5 | 433.1 | 413.7 |
| Inventories, % | 16.14 | 20.3 | 18 | 14.84 | 14.83 | 16.82 | 16.82 | 16.82 | 16.82 | 16.82 |
| Accounts Payable | 694.9 | 597.1 | 563.5 | 521.4 | 318.3 | 449.5 | 429.3 | 410.0 | 391.6 | 374.0 |
| Accounts Payable, % | 18.51 | 17.02 | 15.75 | 14.48 | 10.29 | 15.21 | 15.21 | 15.21 | 15.21 | 15.21 |
| Capital Expenditure | -161.5 | -254.1 | -321.5 | -580.4 | -288.1 | -271.6 | -259.4 | -247.8 | -236.6 | -226.0 |
| Capital Expenditure, % | -4.3 | -7.24 | -8.98 | -16.12 | -9.31 | -9.19 | -9.19 | -9.19 | -9.19 | -9.19 |
| Tax Rate, % | 11.93 | 11.93 | 11.93 | 11.93 | 11.93 | 11.93 | 11.93 | 11.93 | 11.93 | 11.93 |
| EBITAT | 157.8 | 103.7 | 454.7 | 515.5 | 363.8 | 251.7 | 240.4 | 229.6 | 219.3 | 209.4 |
| Depreciation | ||||||||||
| Changes in Account Receivables | ||||||||||
| Changes in Inventories | ||||||||||
| Changes in Accounts Payable | ||||||||||
| Capital Expenditure | ||||||||||
| UFCF | -860.8 | 147.9 | 404.8 | 184.8 | 459.0 | 254.6 | 231.3 | 220.9 | 210.9 | 201.5 |
| WACC, % | 4.91 | 4.91 | 5.02 | 5.02 | 5.02 | 4.98 | 4.98 | 4.98 | 4.98 | 4.98 |
| PV UFCF | ||||||||||
| SUM PV UFCF | 975.0 | |||||||||
| Long Term Growth Rate, % | 3.00 | |||||||||
| Free cash flow (T + 1) | 208 | |||||||||
| Terminal Value | 10,496 | |||||||||
| Present Terminal Value | 8,233 | |||||||||
| Enterprise Value | 9,208 | |||||||||
| Net Debt | -63 | |||||||||
| Equity Value | 9,270 | |||||||||
| Diluted Shares Outstanding, MM | 1,475 | |||||||||
| Equity Value Per Share | 6.29 |
Benefits You Will Receive
- Accurate WKW Financials: Access both historical and projected data for precise valuation.
- Customizable Inputs: Adjust parameters such as WACC, tax rates, revenue growth, and capital investments.
- Real-Time Calculations: Intrinsic value and NPV are calculated automatically and in real-time.
- Scenario Analysis: Evaluate different scenarios to assess the future performance of Beijing WKW Automotive Parts Co., Ltd. (002662SZ).
- User-Friendly Design: Designed for industry professionals while remaining approachable for newcomers.
Key Features
- Genuine WKW Data: Pre-loaded with Beijing WKW Automotive Parts Co., Ltd.’s historical financial performance and future projections.
- Completely Customizable Inputs: Modify revenue growth rates, profit margins, WACC, tax rates, and capital expenditures to suit your analysis.
- Interactive Valuation Model: Automatically recalculates Net Present Value (NPV) and intrinsic value based on your parameter adjustments.
- Scenario Analysis: Develop various forecasting scenarios to explore different valuation possibilities.
- Intuitive User Interface: Designed to be straightforward, organized, and accessible for both seasoned professionals and newcomers.
How It Functions
- Download: Obtain the pre-formatted Excel file containing Beijing WKW Automotive Parts Co., Ltd.'s (002662SZ) financial data.
- Customize: Modify projections, including sales growth, EBITDA margin, and weighted average cost of capital (WACC).
- Real-Time Updates: The intrinsic value and net present value (NPV) calculations refresh automatically.
- Scenario Testing: Generate various forecasts and instantly analyze different outcomes.
- Informed Decisions: Utilize the valuation results to enhance your investment strategy.
Why Choose This Calculator for Beijing WKW Automotive Parts Co., Ltd. (002662SZ)?
- Designed for Industry Leaders: A sophisticated tool trusted by financial analysts, CFOs, and consultants in the automotive sector.
- Comprehensive Data: Historical and projected financial information for WKW Automotive preloaded to ensure precision.
- Scenario Analysis: Effortlessly explore various forecasts and assumptions to assess potential outcomes.
- Insightful Results: Automatically computes intrinsic value, NPV, and essential metrics for informed decision-making.
- User-Friendly Interface: Step-by-step guidance simplifies the calculation process for all users.
Who Can Benefit from This Product?
- Automotive Investors: Make informed decisions with a high-quality valuation tool tailored for the automotive industry.
- Financial Analysts: Streamline your analysis process with a customizable DCF model designed for automotive parts.
- Consultants: Easily modify the template for client presentations or reports specific to the automotive sector.
- Automotive Finance Enthusiasts: Enhance your grasp of valuation methods through practical examples in the automotive field.
- Educators and Students: Utilize it as a hands-on resource for finance courses related to the automotive industry.
Contents of the Template
- Preloaded WKW Data: Historical and forecasted financial information, including revenue, EBIT, and capital expenditures.
- DCF and WACC Models: Professional-quality sheets for determining intrinsic value and Weighted Average Cost of Capital.
- Editable Inputs: Yellow-highlighted cells for modifying revenue growth, tax rates, and discount rates.
- Financial Statements: Detailed annual and quarterly financials for in-depth analysis.
- Key Ratios: Profitability, leverage, and efficiency ratios to assess performance.
- Dashboard and Charts: Visual representations of valuation results and underlying assumptions.
Disclaimer
All information, articles, and product details provided on this website are for general informational and educational purposes only. We do not claim any ownership over, nor do we intend to infringe upon, any trademarks, copyrights, logos, brand names, or other intellectual property mentioned or depicted on this site. Such intellectual property remains the property of its respective owners, and any references here are made solely for identification or informational purposes, without implying any affiliation, endorsement, or partnership.
We make no representations or warranties, express or implied, regarding the accuracy, completeness, or suitability of any content or products presented. Nothing on this website should be construed as legal, tax, investment, financial, medical, or other professional advice. In addition, no part of this site—including articles or product references—constitutes a solicitation, recommendation, endorsement, advertisement, or offer to buy or sell any securities, franchises, or other financial instruments, particularly in jurisdictions where such activity would be unlawful.
All content is of a general nature and may not address the specific circumstances of any individual or entity. It is not a substitute for professional advice or services. Any actions you take based on the information provided here are strictly at your own risk. You accept full responsibility for any decisions or outcomes arising from your use of this website and agree to release us from any liability in connection with your use of, or reliance upon, the content or products found herein.