
|
Hefei Meyer Optoelectronic Technology Inc. (002690.SZ) Valation DCF |
Entièrement Modifiable: Adapté À Vos Besoins Dans Excel Ou Sheets
Conception Professionnelle: Modèles Fiables Et Conformes Aux Normes Du Secteur
Pré-Construits Pour Une Utilisation Rapide Et Efficace
Compatible MAC/PC, entièrement débloqué
Aucune Expertise N'Est Requise; Facile À Suivre
Hefei Meyer Optoelectronic Technology Inc. (002690.SZ) Bundle
Découvrez la vraie valeur de Hefei Meyer Optoelectronic Technology Inc. (002690SZ) avec notre calculatrice avancée DCF! Ajustez les hypothèses clés, explorez divers scénarios et évaluez comment les changements affectent l'évaluation Hefei Meyer Optoelectronic Technology Inc. (002690SZ) - le tout dans un seul modèle Excel.
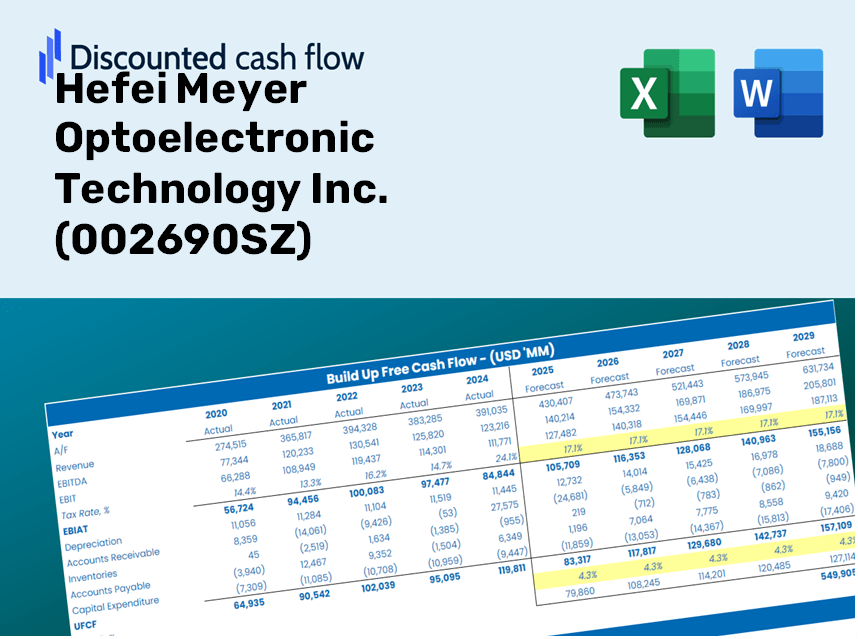
Discounted Cash Flow (DCF) - (USD MM)
| Year | AY1 2020 |
AY2 2021 |
AY3 2022 |
AY4 2023 |
AY5 2024 |
FY1 2025 |
FY2 2026 |
FY3 2027 |
FY4 2028 |
FY5 2029 |
|---|---|---|---|---|---|---|---|---|---|---|
| Revenue | 1,496.0 | 1,812.9 | 2,117.3 | 2,425.4 | 2,310.8 | 2,586.9 | 2,896.1 | 3,242.2 | 3,629.6 | 4,063.4 |
| Revenue Growth, % | 0 | 21.18 | 16.79 | 14.55 | -4.73 | 11.95 | 11.95 | 11.95 | 11.95 | 11.95 |
| EBITDA | 486.7 | 583.6 | 738.5 | 786.8 | 691.4 | 838.0 | 938.2 | 1,050.3 | 1,175.8 | 1,316.3 |
| EBITDA, % | 32.53 | 32.19 | 34.88 | 32.44 | 29.92 | 32.39 | 32.39 | 32.39 | 32.39 | 32.39 |
| Depreciation | 16.8 | 24.8 | 28.9 | 33.7 | 33.0 | 34.5 | 38.6 | 43.2 | 48.4 | 54.2 |
| Depreciation, % | 1.12 | 1.37 | 1.36 | 1.39 | 1.43 | 1.33 | 1.33 | 1.33 | 1.33 | 1.33 |
| EBIT | 469.9 | 558.8 | 709.6 | 753.1 | 658.5 | 803.5 | 899.5 | 1,007.0 | 1,127.4 | 1,262.1 |
| EBIT, % | 31.41 | 30.83 | 33.52 | 31.05 | 28.5 | 31.06 | 31.06 | 31.06 | 31.06 | 31.06 |
| Total Cash | 1,418.1 | 1,533.2 | 1,595.3 | 1,620.4 | 1,861.5 | 2,080.3 | 2,328.9 | 2,607.2 | 2,918.8 | 3,267.6 |
| Total Cash, percent | .0 | .0 | .0 | .0 | .0 | .0 | .0 | .0 | .0 | .0 |
| Account Receivables | 248.0 | 197.4 | 357.3 | 573.8 | 468.4 | 456.7 | 511.3 | 572.4 | 640.8 | 717.4 |
| Account Receivables, % | 16.58 | 10.89 | 16.87 | 23.66 | 20.27 | 17.65 | 17.65 | 17.65 | 17.65 | 17.65 |
| Inventories | 267.7 | 352.5 | 473.0 | 413.5 | 283.7 | 460.5 | 515.5 | 577.1 | 646.1 | 723.3 |
| Inventories, % | 17.9 | 19.45 | 22.34 | 17.05 | 12.28 | 17.8 | 17.8 | 17.8 | 17.8 | 17.8 |
| Accounts Payable | 378.5 | 407.4 | 347.1 | 362.6 | 92.1 | 430.0 | 481.3 | 538.9 | 603.3 | 675.4 |
| Accounts Payable, % | 25.3 | 22.47 | 16.4 | 14.95 | 3.98 | 16.62 | 16.62 | 16.62 | 16.62 | 16.62 |
| Capital Expenditure | -92.4 | -101.4 | -75.8 | -33.7 | -19.3 | -90.9 | -101.8 | -114.0 | -127.6 | -142.8 |
| Capital Expenditure, % | -6.17 | -5.6 | -3.58 | -1.39 | -0.83357 | -3.51 | -3.51 | -3.51 | -3.51 | -3.51 |
| Tax Rate, % | 12.78 | 12.78 | 12.78 | 12.78 | 12.78 | 12.78 | 12.78 | 12.78 | 12.78 | 12.78 |
| EBITAT | 408.0 | 491.2 | 618.2 | 651.5 | 574.3 | 700.0 | 783.6 | 877.3 | 982.1 | 1,099.5 |
| Depreciation | ||||||||||
| Changes in Account Receivables | ||||||||||
| Changes in Inventories | ||||||||||
| Changes in Accounts Payable | ||||||||||
| Capital Expenditure | ||||||||||
| UFCF | 195.2 | 409.2 | 230.7 | 510.0 | 552.6 | 816.3 | 662.2 | 741.4 | 830.0 | 929.1 |
| WACC, % | 7.52 | 7.52 | 7.52 | 7.52 | 7.52 | 7.52 | 7.52 | 7.52 | 7.52 | 7.52 |
| PV UFCF | ||||||||||
| SUM PV UFCF | 3,195.9 | |||||||||
| Long Term Growth Rate, % | 3.00 | |||||||||
| Free cash flow (T + 1) | 957 | |||||||||
| Terminal Value | 21,163 | |||||||||
| Present Terminal Value | 14,726 | |||||||||
| Enterprise Value | 17,922 | |||||||||
| Net Debt | -1,560 | |||||||||
| Equity Value | 19,482 | |||||||||
| Diluted Shares Outstanding, MM | 881 | |||||||||
| Equity Value Per Share | 22.12 |
What You Will Receive
- Customizable Excel Template: A fully editable Excel-based DCF Calculator featuring pre-populated financials for Hefei Meyer Optoelectronic Technology Inc. (002690SZ).
- Authentic Data: Access to historical figures and forward-looking projections (highlighted in the yellow cells).
- Adjustable Forecasts: Modify assumptions regarding revenue growth, EBITDA %, and WACC as needed.
- Instant Calculations: Instantly visualize how your inputs affect the valuation of Hefei Meyer Optoelectronic Technology Inc. (002690SZ).
- Professional Resource: Designed for investors, CFOs, consultants, and financial analysts.
- User-Friendly Interface: Organized for clarity and simplicity, complete with step-by-step guidance.
Key Features
- Comprehensive DCF Calculator: Features in-depth unlevered and levered DCF valuation models tailored for Hefei Meyer Optoelectronic Technology Inc. (002690SZ).
- WACC Calculator: Offers a pre-structured Weighted Average Cost of Capital sheet with adjustable parameters.
- Customizable Forecast Assumptions: Adjust growth projections, capital investments, and discount rates to reflect your analysis.
- Integrated Financial Ratios: Evaluate profitability, leverage, and efficiency ratios specifically for Hefei Meyer Optoelectronic Technology Inc. (002690SZ).
- Visual Dashboard and Charts: Graphical representations provide a summary of critical valuation metrics for straightforward analysis.
How It Works
- Step 1: Download the prebuilt Excel template featuring Hefei Meyer Optoelectronic Technology Inc. (002690SZ) data.
- Step 2: Navigate through the pre-filled sheets and familiarize yourself with the key metrics.
- Step 3: Modify the forecasts and assumptions in the editable yellow cells (WACC, growth, margins) as needed.
- Step 4: Instantly see updated results, including the intrinsic value of Hefei Meyer Optoelectronic Technology Inc. (002690SZ).
- Step 5: Use the outputs to make informed investment decisions or create comprehensive reports.
Why Opt for This Calculator?
- All-in-One Solution: Features DCF, WACC, and financial ratio analyses bundled together.
- Flexible Inputs: Modify the highlighted cells to explore different scenarios.
- In-Depth Analysis: Automatically computes the intrinsic value and Net Present Value for Hefei Meyer Optoelectronic Technology Inc. (002690SZ).
- Pre-Loaded Information: Access to both historical and forecasted data ensures a reliable foundation.
- High-Quality Standards: Perfect for financial analysts, investors, and business advisors.
Who Can Benefit from This Product?
- Professional Investors: Develop comprehensive and trustworthy valuation models for analyzing portfolios centered around Hefei Meyer Optoelectronic Technology Inc. (002690SZ).
- Corporate Finance Teams: Evaluate valuation scenarios to inform strategic decisions within their organizations.
- Consultants and Advisors: Offer clients precise valuation insights pertaining to Hefei Meyer Optoelectronic Technology Inc. (002690SZ).
- Students and Educators: Utilize real-world data to enhance learning and practice in financial modeling.
- Tech Enthusiasts: Gain insight into the market valuation of technology firms like Hefei Meyer Optoelectronic Technology Inc. (002690SZ).
Contents of the Template
- Pre-Filled DCF Model: Hefei Meyer Optoelectronic Technology Inc. (002690SZ) financial data readily available for your analysis.
- WACC Calculator: Comprehensive calculations for the Weighted Average Cost of Capital.
- Financial Ratios: Assess Hefei Meyer’s profitability, leverage, and operational efficiency.
- Editable Inputs: Modify assumptions like growth rates, profit margins, and CAPEX to align with your projections.
- Financial Statements: Access annual and quarterly reports for thorough examination.
- Interactive Dashboard: Effortlessly visualize essential valuation metrics and outcomes.
Disclaimer
All information, articles, and product details provided on this website are for general informational and educational purposes only. We do not claim any ownership over, nor do we intend to infringe upon, any trademarks, copyrights, logos, brand names, or other intellectual property mentioned or depicted on this site. Such intellectual property remains the property of its respective owners, and any references here are made solely for identification or informational purposes, without implying any affiliation, endorsement, or partnership.
We make no representations or warranties, express or implied, regarding the accuracy, completeness, or suitability of any content or products presented. Nothing on this website should be construed as legal, tax, investment, financial, medical, or other professional advice. In addition, no part of this site—including articles or product references—constitutes a solicitation, recommendation, endorsement, advertisement, or offer to buy or sell any securities, franchises, or other financial instruments, particularly in jurisdictions where such activity would be unlawful.
All content is of a general nature and may not address the specific circumstances of any individual or entity. It is not a substitute for professional advice or services. Any actions you take based on the information provided here are strictly at your own risk. You accept full responsibility for any decisions or outcomes arising from your use of this website and agree to release us from any liability in connection with your use of, or reliance upon, the content or products found herein.