
|
Hainan Shuangcheng Pharmaceuticals Co., Ltd. (002693.SZ) Valation DCF |
Entièrement Modifiable: Adapté À Vos Besoins Dans Excel Ou Sheets
Conception Professionnelle: Modèles Fiables Et Conformes Aux Normes Du Secteur
Pré-Construits Pour Une Utilisation Rapide Et Efficace
Compatible MAC/PC, entièrement débloqué
Aucune Expertise N'Est Requise; Facile À Suivre
Hainan Shuangcheng Pharmaceuticals Co., Ltd. (002693.SZ) Bundle
Explorez l'avenir financier de Hainan Shuangcheng Pharmaceuticals Co., Ltd. (002693SZ) avec notre calculatrice DCF conviviale! Entrez vos projections pour la croissance, les marges et les coûts pour calculer la valeur intrinsèque de Hainan Shuangcheng Pharmaceuticals Co., Ltd. (002693SZ) et améliorez votre stratégie d'investissement.
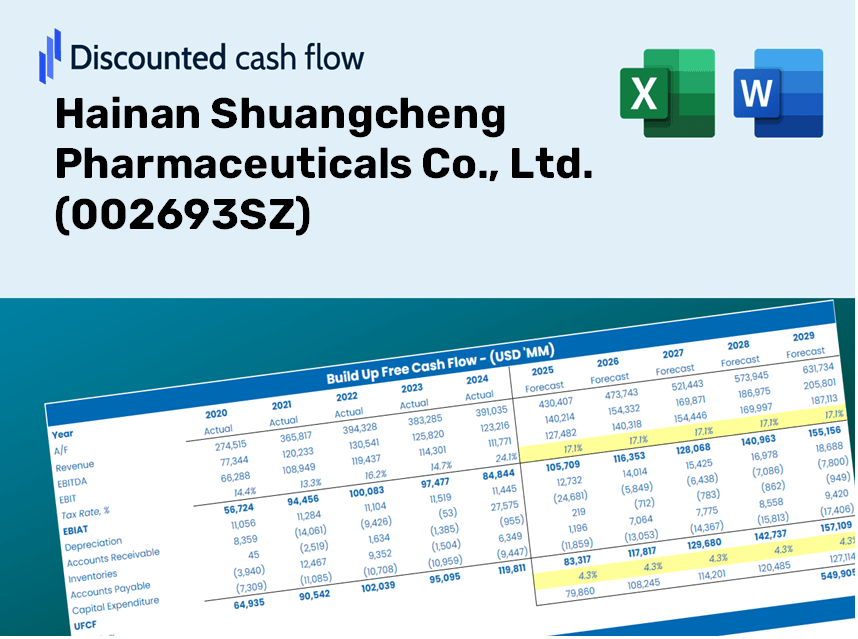
Discounted Cash Flow (DCF) - (USD MM)
| Year | AY1 2020 |
AY2 2021 |
AY3 2022 |
AY4 2023 |
AY5 2024 |
FY1 2025 |
FY2 2026 |
FY3 2027 |
FY4 2028 |
FY5 2029 |
|---|---|---|---|---|---|---|---|---|---|---|
| Revenue | 269.4 | 320.3 | 274.8 | 235.9 | 174.2 | 158.7 | 144.5 | 131.7 | 119.9 | 109.3 |
| Revenue Growth, % | 0 | 18.87 | -14.22 | -14.13 | -26.16 | -8.91 | -8.91 | -8.91 | -8.91 | -8.91 |
| EBITDA | -10.1 | 25.0 | 60.9 | -9.3 | -43.5 | -.8 | -.8 | -.7 | -.6 | -.6 |
| EBITDA, % | -3.73 | 7.8 | 22.16 | -3.94 | -24.95 | -0.5337 | -0.5337 | -0.5337 | -0.5337 | -0.5337 |
| Depreciation | 58.3 | 55.5 | 58.5 | 54.0 | 53.5 | 36.1 | 32.9 | 30.0 | 27.3 | 24.9 |
| Depreciation, % | 21.63 | 17.33 | 21.3 | 22.91 | 30.7 | 22.77 | 22.77 | 22.77 | 22.77 | 22.77 |
| EBIT | -68.3 | -30.5 | 2.4 | -63.3 | -96.9 | -37.0 | -33.7 | -30.7 | -28.0 | -25.5 |
| EBIT, % | -25.37 | -9.53 | 0.85782 | -26.85 | -55.65 | -23.31 | -23.31 | -23.31 | -23.31 | -23.31 |
| Total Cash | 100.0 | 77.0 | 146.0 | 31.9 | 45.1 | 48.8 | 44.4 | 40.5 | 36.9 | 33.6 |
| Total Cash, percent | .0 | .0 | .0 | .0 | .0 | .0 | .0 | .0 | .0 | .0 |
| Account Receivables | 24.9 | 32.6 | 28.1 | 28.3 | 26.6 | 18.1 | 16.5 | 15.0 | 13.7 | 12.4 |
| Account Receivables, % | 9.26 | 10.18 | 10.24 | 11.99 | 15.25 | 11.38 | 11.38 | 11.38 | 11.38 | 11.38 |
| Inventories | 52.8 | 55.2 | 65.4 | 74.3 | 80.5 | 43.9 | 40.0 | 36.4 | 33.2 | 30.2 |
| Inventories, % | 19.59 | 17.25 | 23.81 | 31.5 | 46.23 | 27.67 | 27.67 | 27.67 | 27.67 | 27.67 |
| Accounts Payable | 15.4 | 17.2 | 15.5 | 17.1 | 21.1 | 11.5 | 10.4 | 9.5 | 8.7 | 7.9 |
| Accounts Payable, % | 5.73 | 5.36 | 5.64 | 7.26 | 12.11 | 7.22 | 7.22 | 7.22 | 7.22 | 7.22 |
| Capital Expenditure | -51.6 | -31.6 | -33.0 | -49.2 | -24.9 | -24.2 | -22.0 | -20.1 | -18.3 | -16.6 |
| Capital Expenditure, % | -19.14 | -9.88 | -12 | -20.85 | -14.3 | -15.23 | -15.23 | -15.23 | -15.23 | -15.23 |
| Tax Rate, % | 26.25 | 26.25 | 26.25 | 26.25 | 26.25 | 26.25 | 26.25 | 26.25 | 26.25 | 26.25 |
| EBITAT | -69.4 | -30.9 | 2.3 | -44.0 | -71.5 | -32.5 | -29.6 | -26.9 | -24.5 | -22.4 |
| Depreciation | ||||||||||
| Changes in Account Receivables | ||||||||||
| Changes in Inventories | ||||||||||
| Changes in Accounts Payable | ||||||||||
| Capital Expenditure | ||||||||||
| UFCF | -124.9 | -15.4 | 20.4 | -46.6 | -43.5 | 15.0 | -14.2 | -12.9 | -11.8 | -10.7 |
| WACC, % | 4.9 | 4.9 | 4.89 | 4.81 | 4.82 | 4.86 | 4.86 | 4.86 | 4.86 | 4.86 |
| PV UFCF | ||||||||||
| SUM PV UFCF | -28.0 | |||||||||
| Long Term Growth Rate, % | 4.00 | |||||||||
| Free cash flow (T + 1) | -11 | |||||||||
| Terminal Value | -1,290 | |||||||||
| Present Terminal Value | -1,017 | |||||||||
| Enterprise Value | -1,045 | |||||||||
| Net Debt | 139 | |||||||||
| Equity Value | -1,185 | |||||||||
| Diluted Shares Outstanding, MM | 412 | |||||||||
| Equity Value Per Share | -2.87 |
What You Will Receive
- Genuine Hainan Shuangcheng Data: Comprehensive financials – encompassing revenue to EBIT – derived from actual and projected figures.
- Complete Customization: Modify all essential parameters (highlighted in yellow) such as WACC, growth percentage, and tax rates.
- Immediate Valuation Adjustments: Automatic recalculations to assess how changes affect the fair value of Hainan Shuangcheng Pharmaceuticals (002693SZ).
- Flexible Excel Template: Designed for effortless modifications, scenario analysis, and thorough projections.
- Efficient and Precise: Eliminate the need to create models from the ground up while ensuring accuracy and adaptability.
Key Features
- Customizable Forecast Inputs: Adjust essential variables such as revenue growth, EBITDA %, and capital expenditures for accurate projections.
- Instant DCF Valuation: Quickly computes intrinsic value, NPV, and other financial metrics with ease.
- High-Precision Accuracy: Leverages Hainan Shuangcheng Pharmaceuticals' (002693SZ) actual financial data to deliver realistic valuation results.
- Simplified Scenario Analysis: Effortlessly test various assumptions and analyze the resulting outcomes.
- Efficiency Booster: Avoid the complexities of constructing detailed valuation models from the ground up.
How It Works
- Step 1: Download the Excel file for Hainan Shuangcheng Pharmaceuticals Co., Ltd. (002693SZ).
- Step 2: Review the pre-filled financial data and forecasts specific to Hainan Shuangcheng.
- Step 3: Adjust key inputs such as revenue growth, WACC, and tax rates (highlighted cells).
- Step 4: Observe the DCF model update in real-time as you modify your assumptions.
- Step 5: Evaluate the outputs and leverage the results for informed investment decisions.
Why Choose This Calculator?
- User-Friendly Interface: Perfectly tailored for both novices and seasoned users.
- Customizable Variables: Effortlessly adjust parameters to suit your specific analysis.
- Real-Time Insights: Observe immediate changes in Hainan Shuangcheng Pharmaceuticals Co., Ltd. (002693SZ) valuation with each input modification.
- Preloaded Data: Comes equipped with Hainan Shuangcheng's actual financial information for swift evaluations.
- Endorsed by Experts: A go-to tool for investors and analysts seeking reliable insights.
Who Can Benefit from This Product?
- Professional Investors: Develop in-depth and trustworthy valuation models for analyzing portfolios related to Hainan Shuangcheng Pharmaceuticals Co., Ltd. (002693SZ).
- Corporate Finance Teams: Evaluate valuation scenarios to inform strategic decisions within the company.
- Consultants and Advisors: Equip clients with precise valuation insights for Hainan Shuangcheng Pharmaceuticals Co., Ltd. (002693SZ).
- Students and Educators: Utilize real-world data to enhance learning and practice in financial modeling.
- Pharmaceutical Industry Enthusiasts: Gain insights into how companies like Hainan Shuangcheng Pharmaceuticals Co., Ltd. (002693SZ) are valued in the market.
What the Template Contains
- Preloaded Hainan Shuangcheng Data: Historical and projected financial metrics, including revenue, EBIT, and capital expenditures.
- DCF and WACC Models: High-quality sheets designed for calculating intrinsic value and Weighted Average Cost of Capital.
- Editable Inputs: Yellow-highlighted cells for modifying revenue growth, tax rates, and discount rates.
- Financial Statements: Detailed annual and quarterly financial reports for comprehensive analysis.
- Key Ratios: Ratios for profitability, leverage, and efficiency to assess performance.
- Dashboard and Charts: Visual representations of valuation results and underlying assumptions.
Disclaimer
All information, articles, and product details provided on this website are for general informational and educational purposes only. We do not claim any ownership over, nor do we intend to infringe upon, any trademarks, copyrights, logos, brand names, or other intellectual property mentioned or depicted on this site. Such intellectual property remains the property of its respective owners, and any references here are made solely for identification or informational purposes, without implying any affiliation, endorsement, or partnership.
We make no representations or warranties, express or implied, regarding the accuracy, completeness, or suitability of any content or products presented. Nothing on this website should be construed as legal, tax, investment, financial, medical, or other professional advice. In addition, no part of this site—including articles or product references—constitutes a solicitation, recommendation, endorsement, advertisement, or offer to buy or sell any securities, franchises, or other financial instruments, particularly in jurisdictions where such activity would be unlawful.
All content is of a general nature and may not address the specific circumstances of any individual or entity. It is not a substitute for professional advice or services. Any actions you take based on the information provided here are strictly at your own risk. You accept full responsibility for any decisions or outcomes arising from your use of this website and agree to release us from any liability in connection with your use of, or reliance upon, the content or products found herein.