
|
Chengdu Hongqi Chain Co., Ltd. (002697.SZ) Évaluation DCF |
Entièrement Modifiable: Adapté À Vos Besoins Dans Excel Ou Sheets
Conception Professionnelle: Modèles Fiables Et Conformes Aux Normes Du Secteur
Pré-Construits Pour Une Utilisation Rapide Et Efficace
Compatible MAC/PC, entièrement débloqué
Aucune Expertise N'Est Requise; Facile À Suivre
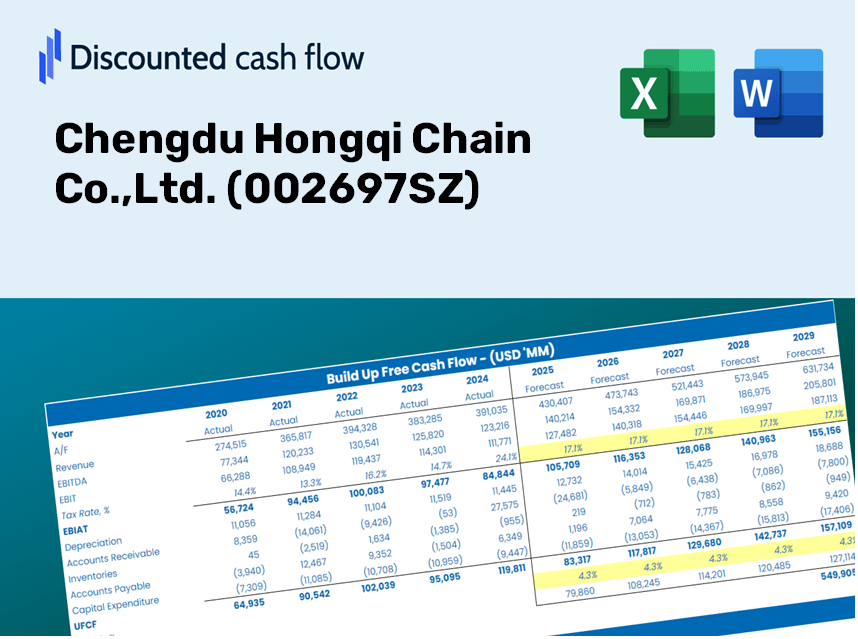
Chengdu Hongqi Chain Co.,Ltd. (002697.SZ) Bundle
Que vous soyez un investisseur ou un analyste, cette calculatrice DCF (002697SZ) est votre ressource incontournable pour une évaluation précise. Chargé de données réelles de Chengdu Hongqi Chain Co., Ltd., vous pouvez ajuster les prévisions et observer instantanément les effets.
Discounted Cash Flow (DCF) - (USD MM)
| Year | AY1 2020 |
AY2 2021 |
AY3 2022 |
AY4 2023 |
AY5 2024 |
FY1 2025 |
FY2 2026 |
FY3 2027 |
FY4 2028 |
FY5 2029 |
|---|---|---|---|---|---|---|---|---|---|---|
| Revenue | 9,053.4 | 9,351.1 | 10,020.1 | 10,132.7 | 10,123.2 | 10,691.5 | 11,291.7 | 11,925.6 | 12,595.0 | 13,302.1 |
| Revenue Growth, % | 0 | 3.29 | 7.15 | 1.12 | -0.09283855 | 5.61 | 5.61 | 5.61 | 5.61 | 5.61 |
| EBITDA | 713.9 | 1,244.4 | 1,383.4 | 1,412.9 | 1,430.6 | 1,348.8 | 1,424.5 | 1,504.4 | 1,588.9 | 1,678.1 |
| EBITDA, % | 7.89 | 13.31 | 13.81 | 13.94 | 14.13 | 12.62 | 12.62 | 12.62 | 12.62 | 12.62 |
| Depreciation | 155.8 | 731.1 | 829.9 | 787.5 | 783.8 | 712.8 | 752.8 | 795.1 | 839.7 | 886.9 |
| Depreciation, % | 1.72 | 7.82 | 8.28 | 7.77 | 7.74 | 6.67 | 6.67 | 6.67 | 6.67 | 6.67 |
| EBIT | 558.1 | 513.4 | 553.5 | 625.5 | 646.8 | 635.9 | 671.6 | 709.4 | 749.2 | 791.2 |
| EBIT, % | 6.16 | 5.49 | 5.52 | 6.17 | 6.39 | 5.95 | 5.95 | 5.95 | 5.95 | 5.95 |
| Total Cash | 2,007.4 | 1,541.1 | 2,286.4 | 2,138.0 | 2,504.8 | 2,294.7 | 2,423.5 | 2,559.6 | 2,703.2 | 2,855.0 |
| Total Cash, percent | .0 | .0 | .0 | .0 | .0 | .0 | .0 | .0 | .0 | .0 |
| Account Receivables | 210.9 | 65.0 | 149.5 | 91.0 | 207.5 | 159.6 | 168.5 | 178.0 | 188.0 | 198.6 |
| Account Receivables, % | 2.33 | 0.69458 | 1.49 | 0.89761 | 2.05 | 1.49 | 1.49 | 1.49 | 1.49 | 1.49 |
| Inventories | 1,291.5 | 1,664.4 | 1,909.3 | 2,037.5 | 2,051.9 | 1,956.5 | 2,066.3 | 2,182.3 | 2,304.8 | 2,434.2 |
| Inventories, % | 14.27 | 17.8 | 19.05 | 20.11 | 20.27 | 18.3 | 18.3 | 18.3 | 18.3 | 18.3 |
| Accounts Payable | 1,227.2 | 1,309.5 | 1,550.6 | 1,561.8 | 1,470.8 | 1,560.4 | 1,648.0 | 1,740.6 | 1,838.3 | 1,941.5 |
| Accounts Payable, % | 13.56 | 14 | 15.47 | 15.41 | 14.53 | 14.6 | 14.6 | 14.6 | 14.6 | 14.6 |
| Capital Expenditure | -136.0 | -127.5 | -56.5 | -71.5 | -33.6 | -95.6 | -100.9 | -106.6 | -112.6 | -118.9 |
| Capital Expenditure, % | -1.5 | -1.36 | -0.56426 | -0.70556 | -0.33223 | -0.89371 | -0.89371 | -0.89371 | -0.89371 | -0.89371 |
| Tax Rate, % | 13.33 | 13.33 | 13.33 | 13.33 | 13.33 | 13.33 | 13.33 | 13.33 | 13.33 | 13.33 |
| EBITAT | 489.9 | 448.4 | 483.9 | 542.8 | 560.6 | 554.5 | 585.7 | 618.5 | 653.3 | 689.9 |
| Depreciation | ||||||||||
| Changes in Account Receivables | ||||||||||
| Changes in Inventories | ||||||||||
| Changes in Accounts Payable | ||||||||||
| Capital Expenditure | ||||||||||
| UFCF | 234.5 | 907.2 | 1,168.8 | 1,200.3 | 1,088.9 | 1,404.8 | 1,206.4 | 1,274.1 | 1,345.6 | 1,421.2 |
| WACC, % | 5.81 | 5.8 | 5.81 | 5.8 | 5.8 | 5.8 | 5.8 | 5.8 | 5.8 | 5.8 |
| PV UFCF | ||||||||||
| SUM PV UFCF | 5,626.8 | |||||||||
| Long Term Growth Rate, % | 2.00 | |||||||||
| Free cash flow (T + 1) | 1,450 | |||||||||
| Terminal Value | 38,112 | |||||||||
| Present Terminal Value | 28,745 | |||||||||
| Enterprise Value | 34,371 | |||||||||
| Net Debt | -2,070 | |||||||||
| Equity Value | 36,442 | |||||||||
| Diluted Shares Outstanding, MM | 1,371 | |||||||||
| Equity Value Per Share | 26.57 |
What You Will Receive
- Authentic 002697SZ Financial Data: Pre-loaded with Chengdu Hongqi Chain Co., Ltd.'s historical and projected figures for accurate analysis.
- Completely Customizable Template: Easily adjust vital inputs like revenue growth, WACC, and EBITDA percentage.
- Instantaneous Calculations: Watch the intrinsic value of Chengdu Hongqi Chain Co., Ltd. update in real-time as you make adjustments.
- Expert Valuation Tool: Tailored for investors, analysts, and consultants who require precise DCF outcomes.
- User-Friendly Layout: Streamlined design with straightforward instructions suitable for all skill levels.
Highlighted Features
- Authentic Financial Data: Gain access to reliable pre-loaded historical figures and future forecasts for Chengdu Hongqi Chain Co., Ltd. (002697SZ).
- Adjustable Forecast Parameters: Modify the yellow-highlighted fields such as WACC, growth rates, and profit margins.
- Real-Time Calculations: Enjoy automatic updates for DCF, Net Present Value (NPV), and cash flow evaluations.
- Interactive Dashboard: Utilize user-friendly charts and summaries to illustrate your valuation findings.
- Suitable for All Skill Levels: A straightforward, intuitive layout designed for investors, CFOs, and consultants alike.
How It Works
- Download: Obtain the pre-configured Excel file containing Chengdu Hongqi Chain Co., Ltd.'s (002697SZ) financial data.
- Customize: Modify projections, including revenue growth, EBITDA percentage, and WACC.
- Update Automatically: Intrinsic value and NPV calculations refresh in real-time.
- Test Scenarios: Generate various forecasts and compare results instantly.
- Make Decisions: Leverage the valuation insights to inform your investment strategy.
Why Choose Chengdu Hongqi Chain Co., Ltd. (002697SZ) Calculator?
- Designed for Experts: A sophisticated tool tailored for analysts, CFOs, and industry consultants.
- Accurate Data: Historical and projected financial data for Chengdu Hongqi Chain preloaded for precision.
- Flexible Scenario Analysis: Effortlessly model various financial forecasts and assumptions.
- Insightful Outputs: Instantly computes intrinsic value, NPV, and essential financial metrics.
- User-Friendly: Comprehensive step-by-step guidance to navigate the calculator seamlessly.
Who Should Use This Product?
- Individual Investors: Gain insights to make informed decisions when buying or selling shares of Chengdu Hongqi Chain Co.,Ltd. (002697SZ).
- Financial Analysts: Enhance valuation processes with comprehensive financial models tailored for Chengdu Hongqi Chain Co.,Ltd. (002697SZ).
- Consultants: Provide accurate and timely valuation insights to clients centered around Chengdu Hongqi Chain Co.,Ltd. (002697SZ).
- Business Owners: Learn how large enterprises like Chengdu Hongqi Chain Co.,Ltd. (002697SZ) are valued to inform your own business strategy.
- Finance Students: Explore valuation methodologies using real data and scenarios related to Chengdu Hongqi Chain Co.,Ltd. (002697SZ).
Contents of the Template
- Pre-Filled Data: Contains Chengdu Hongqi Chain Co., Ltd.'s historical financials and projections.
- Discounted Cash Flow Model: An editable DCF valuation model with automatic calculation features.
- Weighted Average Cost of Capital (WACC): A dedicated sheet for WACC calculation based on user-defined inputs.
- Key Financial Ratios: Evaluate Chengdu Hongqi Chain Co., Ltd.'s profitability, efficiency, and leverage metrics.
- Customizable Inputs: Easily modify revenue growth, margin assumptions, and tax rates.
- User-Friendly Dashboard: Presents charts and tables that summarize essential valuation outcomes.
Disclaimer
All information, articles, and product details provided on this website are for general informational and educational purposes only. We do not claim any ownership over, nor do we intend to infringe upon, any trademarks, copyrights, logos, brand names, or other intellectual property mentioned or depicted on this site. Such intellectual property remains the property of its respective owners, and any references here are made solely for identification or informational purposes, without implying any affiliation, endorsement, or partnership.
We make no representations or warranties, express or implied, regarding the accuracy, completeness, or suitability of any content or products presented. Nothing on this website should be construed as legal, tax, investment, financial, medical, or other professional advice. In addition, no part of this site—including articles or product references—constitutes a solicitation, recommendation, endorsement, advertisement, or offer to buy or sell any securities, franchises, or other financial instruments, particularly in jurisdictions where such activity would be unlawful.
All content is of a general nature and may not address the specific circumstances of any individual or entity. It is not a substitute for professional advice or services. Any actions you take based on the information provided here are strictly at your own risk. You accept full responsibility for any decisions or outcomes arising from your use of this website and agree to release us from any liability in connection with your use of, or reliance upon, the content or products found herein.