
|
Guangdong Xinbao Electrical Appliances Holdings Co., Ltd (002705.SZ) Évaluation DCF |
Entièrement Modifiable: Adapté À Vos Besoins Dans Excel Ou Sheets
Conception Professionnelle: Modèles Fiables Et Conformes Aux Normes Du Secteur
Pré-Construits Pour Une Utilisation Rapide Et Efficace
Compatible MAC/PC, entièrement débloqué
Aucune Expertise N'Est Requise; Facile À Suivre
Guangdong Xinbao Electrical Appliances Holdings Co., Ltd (002705.SZ) Bundle
Découvrez la vraie valeur de Guangdong Xinbao Electrical Appliances Holdings Co., Ltd (002705SZ) avec notre calculatrice avancée DCF! Ajustez les hypothèses clés, explorez divers scénarios et évaluez comment les changements affectent la valorisation de Guangdong Xinbao Electrical Appliances Holdings Co., Ltd (002705SZ) - le tout dans un modèle d'excel complet.
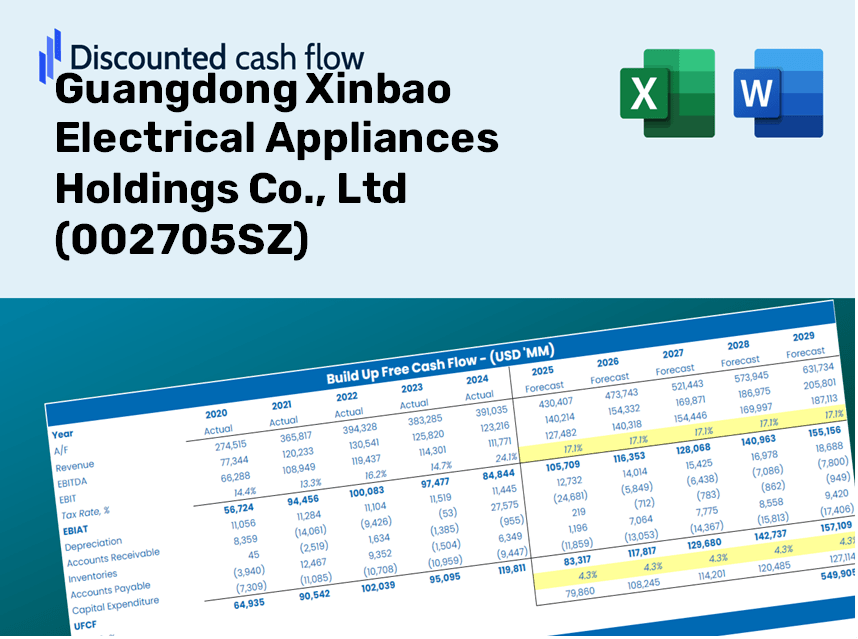
Discounted Cash Flow (DCF) - (USD MM)
| Year | AY1 2020 |
AY2 2021 |
AY3 2022 |
AY4 2023 |
AY5 2024 |
FY1 2025 |
FY2 2026 |
FY3 2027 |
FY4 2028 |
FY5 2029 |
|---|---|---|---|---|---|---|---|---|---|---|
| Revenue | 13,191.0 | 14,912.4 | 13,696.3 | 14,646.8 | 16,821.0 | 17,943.0 | 19,139.7 | 20,416.3 | 21,778.0 | 23,230.5 |
| Revenue Growth, % | 0 | 13.05 | -8.15 | 6.94 | 14.84 | 6.67 | 6.67 | 6.67 | 6.67 | 6.67 |
| EBITDA | 1,773.7 | 1,280.4 | 1,491.0 | 1,834.0 | 1,897.4 | 2,035.4 | 2,171.2 | 2,316.0 | 2,470.5 | 2,635.2 |
| EBITDA, % | 13.45 | 8.59 | 10.89 | 12.52 | 11.28 | 11.34 | 11.34 | 11.34 | 11.34 | 11.34 |
| Depreciation | 354.7 | 398.6 | 456.5 | 588.5 | 621.9 | 588.9 | 628.1 | 670.0 | 714.7 | 762.4 |
| Depreciation, % | 2.69 | 2.67 | 3.33 | 4.02 | 3.7 | 3.28 | 3.28 | 3.28 | 3.28 | 3.28 |
| EBIT | 1,419.0 | 881.8 | 1,034.5 | 1,245.5 | 1,275.5 | 1,446.6 | 1,543.1 | 1,646.0 | 1,755.8 | 1,872.9 |
| EBIT, % | 10.76 | 5.91 | 7.55 | 8.5 | 7.58 | 8.06 | 8.06 | 8.06 | 8.06 | 8.06 |
| Total Cash | 4,603.1 | 3,738.6 | 4,661.3 | 3,714.0 | 3,571.5 | 5,045.2 | 5,381.7 | 5,740.6 | 6,123.5 | 6,531.9 |
| Total Cash, percent | .0 | .0 | .0 | .0 | .0 | .0 | .0 | .0 | .0 | .0 |
| Account Receivables | 2,146.4 | 1,721.8 | 1,503.0 | 1,972.9 | 2,621.9 | 2,434.8 | 2,597.2 | 2,770.4 | 2,955.2 | 3,152.3 |
| Account Receivables, % | 16.27 | 11.55 | 10.97 | 13.47 | 15.59 | 13.57 | 13.57 | 13.57 | 13.57 | 13.57 |
| Inventories | 2,119.7 | 2,652.9 | 1,665.9 | 1,852.8 | 2,221.8 | 2,579.5 | 2,751.6 | 2,935.1 | 3,130.8 | 3,339.7 |
| Inventories, % | 16.07 | 17.79 | 12.16 | 12.65 | 13.21 | 14.38 | 14.38 | 14.38 | 14.38 | 14.38 |
| Accounts Payable | 4,695.3 | 4,483.7 | 3,289.9 | 1,369.3 | 1,763.7 | 3,930.0 | 4,192.2 | 4,471.8 | 4,770.0 | 5,088.2 |
| Accounts Payable, % | 35.59 | 30.07 | 24.02 | 9.35 | 10.48 | 21.9 | 21.9 | 21.9 | 21.9 | 21.9 |
| Capital Expenditure | -925.4 | -1,078.3 | -1,037.6 | -1,984.5 | -1,035.7 | -1,490.3 | -1,589.7 | -1,695.7 | -1,808.8 | -1,929.4 |
| Capital Expenditure, % | -7.02 | -7.23 | -7.58 | -13.55 | -6.16 | -8.31 | -8.31 | -8.31 | -8.31 | -8.31 |
| Tax Rate, % | 20.72 | 20.72 | 20.72 | 20.72 | 20.72 | 20.72 | 20.72 | 20.72 | 20.72 | 20.72 |
| EBITAT | 1,154.9 | 708.5 | 791.5 | 930.9 | 1,011.2 | 1,134.9 | 1,210.6 | 1,291.3 | 1,377.5 | 1,469.3 |
| Depreciation | ||||||||||
| Changes in Account Receivables | ||||||||||
| Changes in Inventories | ||||||||||
| Changes in Accounts Payable | ||||||||||
| Capital Expenditure | ||||||||||
| UFCF | 1,013.4 | -291.5 | 222.4 | -3,042.5 | -26.2 | 2,229.3 | 176.7 | 188.5 | 201.1 | 214.5 |
| WACC, % | 5.57 | 5.56 | 5.53 | 5.51 | 5.55 | 5.55 | 5.55 | 5.55 | 5.55 | 5.55 |
| PV UFCF | ||||||||||
| SUM PV UFCF | 2,756.9 | |||||||||
| Long Term Growth Rate, % | 2.00 | |||||||||
| Free cash flow (T + 1) | 219 | |||||||||
| Terminal Value | 6,170 | |||||||||
| Present Terminal Value | 4,710 | |||||||||
| Enterprise Value | 7,467 | |||||||||
| Net Debt | 748 | |||||||||
| Equity Value | 6,719 | |||||||||
| Diluted Shares Outstanding, MM | 816 | |||||||||
| Equity Value Per Share | 8.23 |
What You Will Receive
- Comprehensive Financial Model: Utilize Guangdong Xinbao’s actual data for accurate DCF valuation.
- Enhanced Forecast Control: Modify revenue growth, profit margins, WACC, and other critical variables.
- Real-Time Calculations: Automatic updates allow you to see outcomes as you adjust inputs.
- Professional-Grade Template: An expertly crafted Excel file tailored for high-quality valuation.
- Flexible and Reusable: Designed for easy customization, enabling repeated use for thorough forecasts.
Key Features
- Comprehensive 002705SZ Data: Pre-loaded with Guangdong Xinbao's historical financials and future projections.
- Customizable Financial Inputs: Tailor revenue growth, profit margins, weighted average cost of capital (WACC), tax rates, and capital expenditures to your preferences.
- Interactive Valuation Model: Automatically refreshes Net Present Value (NPV) and intrinsic value in response to your adjustments.
- Scenario Analysis: Develop various forecasting scenarios to evaluate different valuation possibilities.
- Intuitive User Interface: Designed for ease of use, catering to both seasoned professionals and newcomers.
Understanding the Process
- 1. Access the Template: Download and open the Excel file containing Guangdong Xinbao Electrical Appliances' preloaded data.
- 2. Modify Assumptions: Update key variables such as growth rates, WACC, and capital expenditures as needed.
- 3. Instant Results: The DCF model automatically calculates the intrinsic value and NPV in real-time.
- 4. Explore Scenarios: Evaluate different forecasts to assess various valuation results.
- 5. Present with Assurance: Deliver insightful valuation analysis to back your strategic decisions.
Why Opt for This Calculator?
- All-in-One Solution: Combines DCF, WACC, and financial ratio analyses tailored for [002705SZ].
- Flexible Inputs: Modify the yellow-highlighted fields to explore different scenarios.
- In-Depth Analysis: Automatically computes Guangdong Xinbao's intrinsic value and Net Present Value.
- Preloaded Information: Utilizes historical and projected data to provide reliable starting points.
- High-Quality Insights: Perfect for financial analysts, investors, and business advisors focusing on [002705SZ].
Who Can Benefit from This Product?
- Finance Students: Master valuation methods and apply them using real-time data.
- Researchers: Integrate advanced financial models into your academic projects or studies.
- Investors: Evaluate your own investment hypotheses and assess valuation results for Guangdong Xinbao Electrical Appliances Holdings Co., Ltd (002705SZ).
- Financial Analysts: Enhance your efficiency with a ready-to-use, customizable DCF model.
- Small Business Owners: Understand the analysis techniques applied to large public corporations like Guangdong Xinbao Electrical Appliances Holdings Co., Ltd (002705SZ).
Contents of the Template
- Historical Data: Contains Guangdong Xinbao's previous financial performance and foundational forecasts.
- DCF and Levered DCF Models: Comprehensive templates designed to evaluate Guangdong Xinbao's intrinsic value.
- WACC Sheet: Pre-configured calculations for the Weighted Average Cost of Capital.
- Editable Inputs: Adjust key variables such as growth rates, EBITDA percentages, and CAPEX projections.
- Quarterly and Annual Statements: An exhaustive analysis of Guangdong Xinbao's financial records.
- Interactive Dashboard: Dynamically visualize valuation outcomes and forecasts.
Disclaimer
All information, articles, and product details provided on this website are for general informational and educational purposes only. We do not claim any ownership over, nor do we intend to infringe upon, any trademarks, copyrights, logos, brand names, or other intellectual property mentioned or depicted on this site. Such intellectual property remains the property of its respective owners, and any references here are made solely for identification or informational purposes, without implying any affiliation, endorsement, or partnership.
We make no representations or warranties, express or implied, regarding the accuracy, completeness, or suitability of any content or products presented. Nothing on this website should be construed as legal, tax, investment, financial, medical, or other professional advice. In addition, no part of this site—including articles or product references—constitutes a solicitation, recommendation, endorsement, advertisement, or offer to buy or sell any securities, franchises, or other financial instruments, particularly in jurisdictions where such activity would be unlawful.
All content is of a general nature and may not address the specific circumstances of any individual or entity. It is not a substitute for professional advice or services. Any actions you take based on the information provided here are strictly at your own risk. You accept full responsibility for any decisions or outcomes arising from your use of this website and agree to release us from any liability in connection with your use of, or reliance upon, the content or products found herein.