
|
Shandong Longda Meishi Co., Ltd. (002726.SZ) Valation DCF |
Entièrement Modifiable: Adapté À Vos Besoins Dans Excel Ou Sheets
Conception Professionnelle: Modèles Fiables Et Conformes Aux Normes Du Secteur
Pré-Construits Pour Une Utilisation Rapide Et Efficace
Compatible MAC/PC, entièrement débloqué
Aucune Expertise N'Est Requise; Facile À Suivre
Shandong Longda Meishi Co., Ltd. (002726.SZ) Bundle
Que vous soyez un investisseur ou un analyste, cette calculatrice DCF (002726SZ) est votre ressource incontournable pour une évaluation précise. Rempli de données réelles de Shandong Longda Meishi Co., Ltd., vous pouvez ajuster les prévisions et observer instantanément les effets.
What You Will Receive
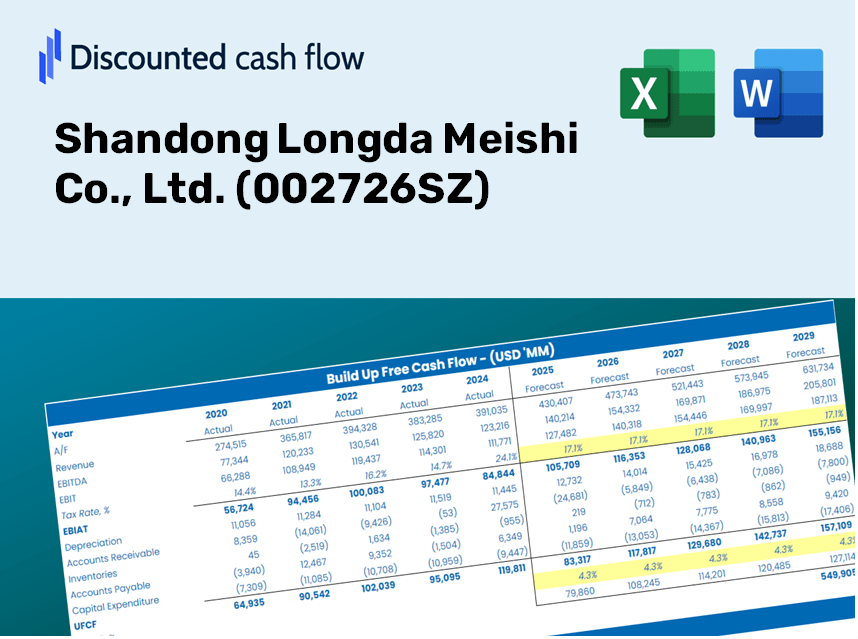
- Actual Longda Meishi Financials: Comprehensive historical and projected data for precise valuation.
- Customizable Inputs: Adjust WACC, tax rates, revenue growth, and capital expenditures as needed.
- Automated Calculations: Intrinsic value and NPV are calculated in real-time.
- Scenario Testing: Explore various scenarios to assess Shandong Longda Meishi's future performance.
- User-Friendly Design: Designed for industry experts while remaining accessible to newcomers.
Key Features
- Comprehensive Historical Data: Access Shandong Longda Meishi Co., Ltd.'s (002726SZ) past financial statements and projected forecasts.
- Customizable Parameters: Adjust inputs such as WACC, tax rates, revenue growth, and EBITDA margins to fit your analysis.
- Real-Time Calculations: Instantly view the recalculated intrinsic value for Shandong Longda Meishi Co., Ltd. (002726SZ).
- Intuitive Visualizations: User-friendly dashboard charts present valuation results and essential metrics clearly.
- Designed for Precision: A reliable tool tailored for analysts, investors, and financial professionals.
How It Works
- Step 1: Download the Excel file.
- Step 2: Examine the pre-filled financial data and projections for Shandong Longda Meishi Co., Ltd. (002726SZ).
- Step 3: Adjust key inputs such as revenue growth, WACC, and tax rates (highlighted cells).
- Step 4: Observe the DCF model refresh in real-time as you modify your assumptions.
- Step 5: Evaluate the results and utilize the insights for your investment strategies.
Why Opt for This Calculator?
- Designed for Experts: A sophisticated tool utilized by analysts, CFOs, and consultants alike.
- Accurate Data: Shandong Longda Meishi Co., Ltd.'s historical and projected financials preloaded for precision.
- Scenario Analysis: Effortlessly simulate various forecasts and assumptions.
- Transparent Results: Instantly computes intrinsic value, NPV, and essential metrics.
- User-Friendly: Clear, step-by-step guidance to navigate through the calculations.
Who Can Benefit from Shandong Longda Meishi Co., Ltd. (002726SZ)?
- Investors: Make informed investment choices with a reliable, industry-specific analysis tool.
- Financial Analysts: Enhance efficiency with a customizable financial model tailored for the food industry.
- Consultants: Effortlessly modify the framework for client presentations and strategic reports.
- Food Industry Enthusiasts: Expand your knowledge of market trends and valuation strategies through practical examples.
- Educators and Students: Utilize it as a hands-on resource for coursework in finance or business studies related to the food sector.
What the Template Includes
- Preloaded 002726SZ Data: Historical and projected financial information, including revenue, EBIT, and capital expenditures.
- DCF and WACC Models: Professional-caliber worksheets for determining intrinsic value and Weighted Average Cost of Capital.
- Editable Inputs: Yellow-highlighted cells for modifying revenue growth, tax rates, and discount rates.
- Financial Statements: Detailed annual and quarterly financials for in-depth analysis.
- Key Ratios: Ratios related to profitability, leverage, and efficiency to assess performance.
- Dashboard and Charts: Visual representations of valuation results and underlying assumptions.
Disclaimer
All information, articles, and product details provided on this website are for general informational and educational purposes only. We do not claim any ownership over, nor do we intend to infringe upon, any trademarks, copyrights, logos, brand names, or other intellectual property mentioned or depicted on this site. Such intellectual property remains the property of its respective owners, and any references here are made solely for identification or informational purposes, without implying any affiliation, endorsement, or partnership.
We make no representations or warranties, express or implied, regarding the accuracy, completeness, or suitability of any content or products presented. Nothing on this website should be construed as legal, tax, investment, financial, medical, or other professional advice. In addition, no part of this site—including articles or product references—constitutes a solicitation, recommendation, endorsement, advertisement, or offer to buy or sell any securities, franchises, or other financial instruments, particularly in jurisdictions where such activity would be unlawful.
All content is of a general nature and may not address the specific circumstances of any individual or entity. It is not a substitute for professional advice or services. Any actions you take based on the information provided here are strictly at your own risk. You accept full responsibility for any decisions or outcomes arising from your use of this website and agree to release us from any liability in connection with your use of, or reliance upon, the content or products found herein.