
|
Sunflower Pharmaceutical Group Co., Ltd (002737.SZ) Valation DCF |
Entièrement Modifiable: Adapté À Vos Besoins Dans Excel Ou Sheets
Conception Professionnelle: Modèles Fiables Et Conformes Aux Normes Du Secteur
Pré-Construits Pour Une Utilisation Rapide Et Efficace
Compatible MAC/PC, entièrement débloqué
Aucune Expertise N'Est Requise; Facile À Suivre
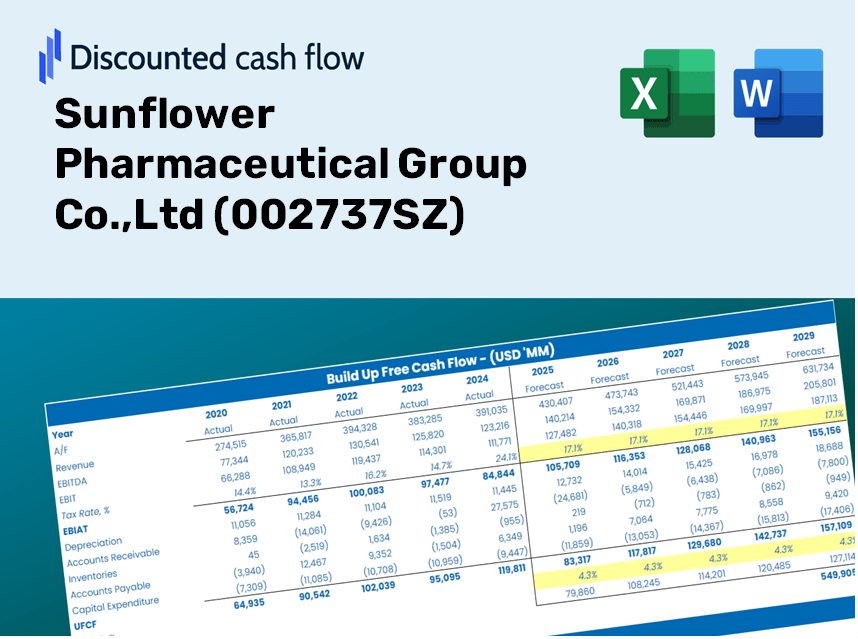
Sunflower Pharmaceutical Group Co.,Ltd (002737.SZ) Bundle
Explorez les perspectives financières de Sunflower Pharmaceutical Group Co., Ltd (002737SZ) avec notre calculatrice DCF conviviale! Entrez vos projections pour la croissance, les marges et les dépenses pour déterminer la valeur intrinsèque de Sunflower Pharmaceutical Group Co., Ltd (002737SZ) et améliorez votre stratégie d'investissement.
Discounted Cash Flow (DCF) - (USD MM)
| Year | AY1 2020 |
AY2 2021 |
AY3 2022 |
AY4 2023 |
AY5 2024 |
FY1 2025 |
FY2 2026 |
FY3 2027 |
FY4 2028 |
FY5 2029 |
|---|---|---|---|---|---|---|---|---|---|---|
| Revenue | 3,461.9 | 4,460.9 | 5,094.5 | 5,700.3 | 3,377.0 | 3,514.8 | 3,658.2 | 3,807.4 | 3,962.7 | 4,124.3 |
| Revenue Growth, % | 0 | 28.86 | 14.2 | 11.89 | -40.76 | 4.08 | 4.08 | 4.08 | 4.08 | 4.08 |
| EBITDA | 811.1 | 935.8 | 1,285.0 | 1,358.3 | 625.7 | 787.2 | 819.3 | 852.7 | 887.5 | 923.7 |
| EBITDA, % | 23.43 | 20.98 | 25.22 | 23.83 | 18.53 | 22.4 | 22.4 | 22.4 | 22.4 | 22.4 |
| Depreciation | 149.2 | 164.5 | 262.6 | 174.8 | 172.8 | 150.0 | 156.1 | 162.5 | 169.1 | 176.0 |
| Depreciation, % | 4.31 | 3.69 | 5.16 | 3.07 | 5.12 | 4.27 | 4.27 | 4.27 | 4.27 | 4.27 |
| EBIT | 661.9 | 771.3 | 1,022.4 | 1,183.5 | 452.8 | 637.2 | 663.2 | 690.3 | 718.4 | 747.7 |
| EBIT, % | 19.12 | 17.29 | 20.07 | 20.76 | 13.41 | 18.13 | 18.13 | 18.13 | 18.13 | 18.13 |
| Total Cash | 1,798.4 | 1,988.8 | 3,847.4 | 3,602.1 | 2,298.5 | 2,132.1 | 2,219.1 | 2,309.6 | 2,403.8 | 2,501.9 |
| Total Cash, percent | .0 | .0 | .0 | .0 | .0 | .0 | .0 | .0 | .0 | .0 |
| Account Receivables | 311.0 | 281.2 | 226.8 | 110.1 | 599.9 | 277.2 | 288.5 | 300.3 | 312.5 | 325.3 |
| Account Receivables, % | 8.98 | 6.3 | 4.45 | 1.93 | 17.76 | 7.89 | 7.89 | 7.89 | 7.89 | 7.89 |
| Inventories | 562.2 | 709.6 | 632.1 | 873.2 | 867.3 | 601.4 | 625.9 | 651.5 | 678.1 | 705.7 |
| Inventories, % | 16.24 | 15.91 | 12.41 | 15.32 | 25.68 | 17.11 | 17.11 | 17.11 | 17.11 | 17.11 |
| Accounts Payable | 447.9 | 547.2 | 714.5 | 734.6 | 319.0 | 432.8 | 450.4 | 468.8 | 487.9 | 507.8 |
| Accounts Payable, % | 12.94 | 12.27 | 14.02 | 12.89 | 9.45 | 12.31 | 12.31 | 12.31 | 12.31 | 12.31 |
| Capital Expenditure | -212.7 | -118.3 | -152.9 | -149.2 | -92.8 | -120.6 | -125.6 | -130.7 | -136.0 | -141.6 |
| Capital Expenditure, % | -6.14 | -2.65 | -3 | -2.62 | -2.75 | -3.43 | -3.43 | -3.43 | -3.43 | -3.43 |
| Tax Rate, % | 22.45 | 22.45 | 22.45 | 22.45 | 22.45 | 22.45 | 22.45 | 22.45 | 22.45 | 22.45 |
| EBITAT | 504.5 | 607.7 | 820.1 | 977.7 | 351.2 | 503.9 | 524.5 | 545.8 | 568.1 | 591.3 |
| Depreciation | ||||||||||
| Changes in Account Receivables | ||||||||||
| Changes in Inventories | ||||||||||
| Changes in Accounts Payable | ||||||||||
| Capital Expenditure | ||||||||||
| UFCF | 15.6 | 635.5 | 1,229.1 | 899.0 | -468.2 | 1,235.5 | 536.8 | 558.7 | 581.5 | 605.2 |
| WACC, % | 4.62 | 4.62 | 4.62 | 4.62 | 4.62 | 4.62 | 4.62 | 4.62 | 4.62 | 4.62 |
| PV UFCF | ||||||||||
| SUM PV UFCF | 3,127.4 | |||||||||
| Long Term Growth Rate, % | 3.00 | |||||||||
| Free cash flow (T + 1) | 623 | |||||||||
| Terminal Value | 38,455 | |||||||||
| Present Terminal Value | 30,680 | |||||||||
| Enterprise Value | 33,807 | |||||||||
| Net Debt | -1,036 | |||||||||
| Equity Value | 34,844 | |||||||||
| Diluted Shares Outstanding, MM | 586 | |||||||||
| Equity Value Per Share | 59.48 |
Benefits You Will Receive
- Customizable Excel Template: A fully editable Excel-based DCF Calculator featuring pre-filled financial data for Sunflower Pharmaceutical Group Co.,Ltd (002737SZ).
- Accurate Data: Access to historical performance and forward-looking projections (highlighted in the yellow cells).
- Flexible Forecasting: Adjust key assumptions such as revenue growth, EBITDA margin, and WACC.
- Instant Calculations: Quickly observe how your inputs affect the valuation of Sunflower Pharmaceutical Group Co.,Ltd (002737SZ).
- Professional Resource: Designed for use by investors, CFOs, consultants, and financial analysts.
- User-Friendly Interface: Organized for simplicity and ease, featuring detailed step-by-step guidance.
Highlighted Features
- Comprehensive DCF Tool: Features detailed unlevered and levered DCF valuation frameworks tailored for Sunflower Pharmaceutical Group Co., Ltd (002737SZ).
- WACC Assessment Tool: A pre-configured Weighted Average Cost of Capital calculator with adjustable inputs for precise analysis.
- Customizable Forecast Parameters: Update growth rates, capital expenditures, and discount rates as needed.
- Integrated Financial Ratios: Evaluate profitability, leverage, and efficiency ratios specific to Sunflower Pharmaceutical Group Co., Ltd (002737SZ).
- Analytics Dashboard and Visuals: Graphical displays summarize essential valuation metrics for straightforward evaluation.
How It Works
- Download: Obtain the user-friendly Excel file containing Sunflower Pharmaceutical Group Co., Ltd's (002737SZ) financial data.
- Customize: Modify forecasts such as revenue growth, EBITDA %, and WACC to suit your analysis.
- Update Automatically: Watch as intrinsic value and NPV calculations refresh in real-time.
- Test Scenarios: Generate various projections and instantly compare the results.
- Make Decisions: Utilize the valuation findings to inform your investment approach.
Why Opt for Our Calculator?
- Time-Saving: Skip the hassle of building a DCF model from the ground up – it's immediately available for use.
- Enhanced Accuracy: Trustworthy financial data and established formulas minimize valuation errors.
- Completely Customizable: Adapt the model to suit your specific assumptions and forecasts.
- Simple to Understand: Intuitive charts and outputs facilitate easy analysis of results.
- Endorsed by Professionals: Crafted for experts who prioritize both accuracy and usability.
Who Should Use This Product?
- Individual Investors: Make well-informed choices regarding buying or selling shares of Sunflower Pharmaceutical Group Co.,Ltd (002737SZ).
- Financial Analysts: Enhance valuation procedures with ready-to-implement financial models tailored for the pharmaceutical sector.
- Consultants: Provide precise valuation insights to clients in a timely manner.
- Business Owners: Gain insights into how large pharmaceutical companies like Sunflower are valued to refine your own business strategy.
- Finance Students: Master valuation methods through the analysis of real-world data and case studies in the pharmaceutical industry.
Contents of the Template
- In-Depth DCF Model: Customizable template featuring thorough valuation calculations.
- Actual Financial Data: Sunflower Pharmaceutical Group’s historical and projected financial figures preloaded for analysis.
- Adjustable Parameters: Modify WACC, growth rates, and tax assumptions to explore various scenarios.
- Comprehensive Financial Statements: Detailed annual and quarterly reports for enhanced insights.
- Essential Ratios: Integrated analysis for profitability, efficiency, and leverage metrics.
- Interactive Dashboard with Visual Outputs: Charts and tables designed for clear, actionable insights.
Disclaimer
All information, articles, and product details provided on this website are for general informational and educational purposes only. We do not claim any ownership over, nor do we intend to infringe upon, any trademarks, copyrights, logos, brand names, or other intellectual property mentioned or depicted on this site. Such intellectual property remains the property of its respective owners, and any references here are made solely for identification or informational purposes, without implying any affiliation, endorsement, or partnership.
We make no representations or warranties, express or implied, regarding the accuracy, completeness, or suitability of any content or products presented. Nothing on this website should be construed as legal, tax, investment, financial, medical, or other professional advice. In addition, no part of this site—including articles or product references—constitutes a solicitation, recommendation, endorsement, advertisement, or offer to buy or sell any securities, franchises, or other financial instruments, particularly in jurisdictions where such activity would be unlawful.
All content is of a general nature and may not address the specific circumstances of any individual or entity. It is not a substitute for professional advice or services. Any actions you take based on the information provided here are strictly at your own risk. You accept full responsibility for any decisions or outcomes arising from your use of this website and agree to release us from any liability in connection with your use of, or reliance upon, the content or products found herein.