
|
Guangdong Guanghua Sci-Tech Co., Ltd. (002741.SZ) Valation DCF |
Entièrement Modifiable: Adapté À Vos Besoins Dans Excel Ou Sheets
Conception Professionnelle: Modèles Fiables Et Conformes Aux Normes Du Secteur
Pré-Construits Pour Une Utilisation Rapide Et Efficace
Compatible MAC/PC, entièrement débloqué
Aucune Expertise N'Est Requise; Facile À Suivre
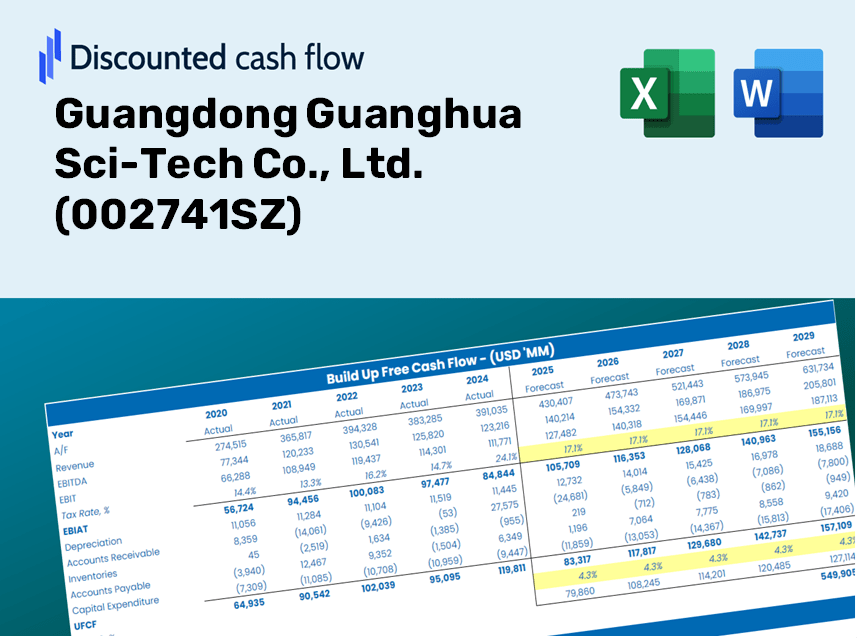
Guangdong Guanghua Sci-Tech Co., Ltd. (002741.SZ) Bundle
Explorez l'avenir financier de Guangdong Guanghua Sci-Tech Co., Ltd. (002741SZ) avec notre calculatrice DCF conviviale! Entrez vos hypothèses pour la croissance, les marges et les coûts pour calculer la valeur intrinsèque de Guangdong Guanghua Sci-Tech Co., Ltd. (002741SZ) et améliorez votre stratégie d'investissement.
Discounted Cash Flow (DCF) - (USD MM)
| Year | AY1 2020 |
AY2 2021 |
AY3 2022 |
AY4 2023 |
AY5 2024 |
FY1 2025 |
FY2 2026 |
FY3 2027 |
FY4 2028 |
FY5 2029 |
|---|---|---|---|---|---|---|---|---|---|---|
| Revenue | 2,014.3 | 2,580.1 | 3,302.3 | 2,699.5 | 2,589.0 | 2,807.4 | 3,044.1 | 3,300.9 | 3,579.3 | 3,881.2 |
| Revenue Growth, % | 0 | 28.09 | 27.99 | -18.26 | -4.09 | 8.43 | 8.43 | 8.43 | 8.43 | 8.43 |
| EBITDA | 123.7 | 157.6 | 213.0 | -276.4 | 136.0 | 77.0 | 83.5 | 90.5 | 98.1 | 106.4 |
| EBITDA, % | 6.14 | 6.11 | 6.45 | -10.24 | 5.25 | 2.74 | 2.74 | 2.74 | 2.74 | 2.74 |
| Depreciation | 75.2 | 86.6 | 102.3 | 137.0 | 130.7 | 114.1 | 123.7 | 134.1 | 145.4 | 157.7 |
| Depreciation, % | 3.73 | 3.36 | 3.1 | 5.08 | 5.05 | 4.06 | 4.06 | 4.06 | 4.06 | 4.06 |
| EBIT | 48.4 | 71.0 | 110.6 | -413.4 | 5.3 | -37.1 | -40.2 | -43.6 | -47.3 | -51.3 |
| EBIT, % | 2.41 | 2.75 | 3.35 | -15.32 | 0.20402 | -1.32 | -1.32 | -1.32 | -1.32 | -1.32 |
| Total Cash | 258.0 | 236.4 | 330.4 | 328.6 | 739.4 | 408.2 | 442.7 | 480.0 | 520.5 | 564.4 |
| Total Cash, percent | .0 | .0 | .0 | .0 | .0 | .0 | .0 | .0 | .0 | .0 |
| Account Receivables | 779.1 | 956.5 | 847.5 | 826.2 | 888.7 | 934.0 | 1,012.8 | 1,098.2 | 1,190.8 | 1,291.3 |
| Account Receivables, % | 38.68 | 37.07 | 25.66 | 30.61 | 34.33 | 33.27 | 33.27 | 33.27 | 33.27 | 33.27 |
| Inventories | 341.9 | 489.9 | 762.0 | 269.9 | 238.1 | 439.3 | 476.3 | 516.5 | 560.1 | 607.3 |
| Inventories, % | 16.98 | 18.99 | 23.07 | 10 | 9.2 | 15.65 | 15.65 | 15.65 | 15.65 | 15.65 |
| Accounts Payable | 362.7 | 579.3 | 660.2 | 648.0 | 543.5 | 592.1 | 642.0 | 696.1 | 754.9 | 818.5 |
| Accounts Payable, % | 18.01 | 22.45 | 19.99 | 24.01 | 20.99 | 21.09 | 21.09 | 21.09 | 21.09 | 21.09 |
| Capital Expenditure | -82.7 | -91.3 | -188.3 | -104.6 | -53.3 | -108.3 | -117.4 | -127.3 | -138.0 | -149.7 |
| Capital Expenditure, % | -4.11 | -3.54 | -5.7 | -3.88 | -2.06 | -3.86 | -3.86 | -3.86 | -3.86 | -3.86 |
| Tax Rate, % | -1.79 | -1.79 | -1.79 | -1.79 | -1.79 | -1.79 | -1.79 | -1.79 | -1.79 | -1.79 |
| EBITAT | 56.2 | 79.3 | 155.6 | -345.0 | 5.4 | -35.8 | -38.9 | -42.1 | -45.7 | -49.6 |
| Depreciation | ||||||||||
| Changes in Account Receivables | ||||||||||
| Changes in Inventories | ||||||||||
| Changes in Accounts Payable | ||||||||||
| Capital Expenditure | ||||||||||
| UFCF | -709.7 | -34.1 | -12.7 | 188.7 | -52.5 | -227.9 | -98.5 | -106.8 | -115.8 | -125.6 |
| WACC, % | 6.63 | 6.63 | 6.63 | 6.57 | 6.63 | 6.62 | 6.62 | 6.62 | 6.62 | 6.62 |
| PV UFCF | ||||||||||
| SUM PV UFCF | -569.3 | |||||||||
| Long Term Growth Rate, % | 3.50 | |||||||||
| Free cash flow (T + 1) | -130 | |||||||||
| Terminal Value | -4,169 | |||||||||
| Present Terminal Value | -3,026 | |||||||||
| Enterprise Value | -3,596 | |||||||||
| Net Debt | 86 | |||||||||
| Equity Value | -3,682 | |||||||||
| Diluted Shares Outstanding, MM | 402 | |||||||||
| Equity Value Per Share | -9.16 |
What You Will Receive
- Genuine Guanghua Sci-Tech Financials: Comes with comprehensive historical and projected data for precise valuation.
- Customizable Inputs: Adjust metrics such as WACC, tax rates, revenue growth, and capital expenditures.
- Instant Calculations: Dynamic computation of intrinsic value and NPV.
- Scenario Analysis: Explore various scenarios to assess the future performance of Guangdong Guanghua Sci-Tech Co., Ltd. (002741SZ).
- User-Friendly and Professional Design: Tailored for industry experts while remaining easy for newcomers to navigate.
Key Features
- 🔍 Real-Life Guanghua Financials: Pre-filled historical and projected data for Guangdong Guanghua Sci-Tech Co., Ltd. (002741SZ).
- ✏️ Fully Customizable Inputs: Modify all essential parameters (yellow cells) such as WACC, growth %, and tax rates.
- 📊 Professional DCF Valuation: Integrated formulas compute the intrinsic value of Guanghua using the Discounted Cash Flow method.
- ⚡ Instant Results: Visualize the valuation of Guanghua instantly upon adjusting any inputs.
- Scenario Analysis: Evaluate and compare outcomes for different financial scenarios side-by-side.
How It Functions
- 1. Access the Template: Download and open the Excel file containing Guangdong Guanghua Sci-Tech Co., Ltd.'s preloaded data.
- 2. Adjust Assumptions: Modify key variables such as growth rates, WACC, and capital expenditures.
- 3. Instant Result Generation: The DCF model automatically calculates intrinsic value and NPV in real-time.
- 4. Explore Various Scenarios: Evaluate different forecasts to assess multiple valuation outcomes.
- 5. Present with Assurance: Share professional valuation insights to bolster your decision-making process for (002741SZ).
Why Choose This Calculator for Guangdong Guanghua Sci-Tech Co., Ltd. (002741SZ)?
- All-in-One Solution: Offers comprehensive analysis tools including DCF, WACC, and financial ratios.
- Flexible Inputs: Modify the highlighted fields to explore different financial scenarios.
- In-Depth Analysis: Automatically computes the intrinsic value and Net Present Value for Guangdong Guanghua Sci-Tech Co., Ltd. (002741SZ).
- Preloaded Information: Comes with historical and projected data for reliable initial assessments.
- High-Quality Standards: Perfect for financial analysts, investors, and business consultants seeking precision.
Who Can Benefit from Guangdong Guanghua Sci-Tech Co., Ltd. (002741SZ)?
- Investors: Enhance your investment strategy with a robust valuation tool tailored for the tech industry.
- Financial Analysts: Streamline your analysis process with a ready-to-use DCF model that you can easily customize.
- Consultants: Efficiently modify the template for impactful client presentations and comprehensive reports.
- Finance Enthusiasts: Expand your knowledge of valuation methods through real-life applications and case studies.
- Educators and Students: Utilize this resource as a valuable learning aid in finance and technology courses.
Contents of the Template
- Pre-Filled Data: Features Guangdong Guanghua Sci-Tech Co., Ltd.'s (002741SZ) historical financials and forecasts.
- Discounted Cash Flow Model: An adjustable DCF valuation model with automatic calculations.
- Weighted Average Cost of Capital (WACC): A specific sheet for WACC calculations based on user-defined inputs.
- Key Financial Ratios: Evaluate the profitability, efficiency, and leverage of Guangdong Guanghua Sci-Tech Co., Ltd. (002741SZ).
- Customizable Inputs: Easily modify revenue growth, margins, and tax rates.
- Clear Dashboard: Visuals and tables that summarize essential valuation outcomes.
Disclaimer
All information, articles, and product details provided on this website are for general informational and educational purposes only. We do not claim any ownership over, nor do we intend to infringe upon, any trademarks, copyrights, logos, brand names, or other intellectual property mentioned or depicted on this site. Such intellectual property remains the property of its respective owners, and any references here are made solely for identification or informational purposes, without implying any affiliation, endorsement, or partnership.
We make no representations or warranties, express or implied, regarding the accuracy, completeness, or suitability of any content or products presented. Nothing on this website should be construed as legal, tax, investment, financial, medical, or other professional advice. In addition, no part of this site—including articles or product references—constitutes a solicitation, recommendation, endorsement, advertisement, or offer to buy or sell any securities, franchises, or other financial instruments, particularly in jurisdictions where such activity would be unlawful.
All content is of a general nature and may not address the specific circumstances of any individual or entity. It is not a substitute for professional advice or services. Any actions you take based on the information provided here are strictly at your own risk. You accept full responsibility for any decisions or outcomes arising from your use of this website and agree to release us from any liability in connection with your use of, or reliance upon, the content or products found herein.