
|
Yunnan Energy New Material Co., Ltd. (002812.SZ) Évaluation DCF |
Entièrement Modifiable: Adapté À Vos Besoins Dans Excel Ou Sheets
Conception Professionnelle: Modèles Fiables Et Conformes Aux Normes Du Secteur
Pré-Construits Pour Une Utilisation Rapide Et Efficace
Compatible MAC/PC, entièrement débloqué
Aucune Expertise N'Est Requise; Facile À Suivre
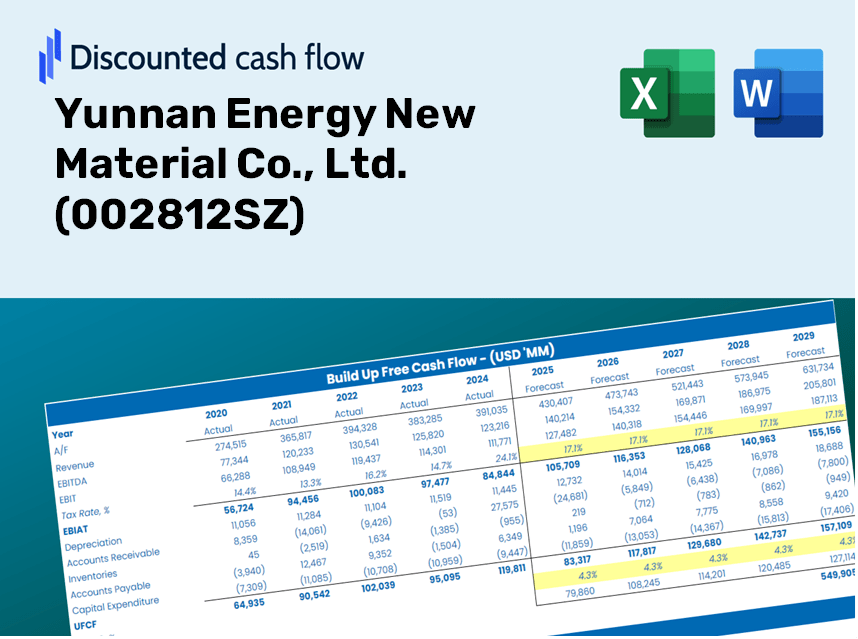
Yunnan Energy New Material Co., Ltd. (002812.SZ) Bundle
Conçu pour la précision, notre calculatrice DCF (002812SZ) vous permet d'évaluer l'évaluation de Yunnan Energy New Material Co., Ltd. à l'aide de données financières réelles, permettant une flexibilité complète pour modifier tous les paramètres essentiels pour des projections améliorées.
Discounted Cash Flow (DCF) - (USD MM)
| Year | AY1 2020 |
AY2 2021 |
AY3 2022 |
AY4 2023 |
AY5 2024 |
FY1 2025 |
FY2 2026 |
FY3 2027 |
FY4 2028 |
FY5 2029 |
|---|---|---|---|---|---|---|---|---|---|---|
| Revenue | 4,283.0 | 7,982.4 | 12,590.9 | 12,042.2 | 10,163.7 | 13,318.2 | 17,451.8 | 22,868.4 | 29,966.2 | 39,266.9 |
| Revenue Growth, % | 0 | 86.37 | 57.73 | -4.36 | -15.6 | 31.04 | 31.04 | 31.04 | 31.04 | 31.04 |
| EBITDA | 2,075.2 | 4,237.3 | 6,131.9 | 4,890.1 | 1,303.4 | 5,425.0 | 7,108.8 | 9,315.1 | 12,206.3 | 15,994.8 |
| EBITDA, % | 48.45 | 53.08 | 48.7 | 40.61 | 12.82 | 40.73 | 40.73 | 40.73 | 40.73 | 40.73 |
| Depreciation | 561.3 | 801.1 | 1,069.2 | 1,479.7 | 1,795.1 | 1,640.3 | 2,149.5 | 2,816.6 | 3,690.8 | 4,836.3 |
| Depreciation, % | 13.1 | 10.04 | 8.49 | 12.29 | 17.66 | 12.32 | 12.32 | 12.32 | 12.32 | 12.32 |
| EBIT | 1,513.9 | 3,436.2 | 5,062.6 | 3,410.3 | -491.7 | 3,784.6 | 4,959.3 | 6,498.5 | 8,515.5 | 11,158.5 |
| EBIT, % | 35.35 | 43.05 | 40.21 | 28.32 | -4.84 | 28.42 | 28.42 | 28.42 | 28.42 | 28.42 |
| Total Cash | 3,715.3 | 1,838.6 | 3,964.2 | 3,835.5 | 3,077.1 | 5,417.5 | 7,099.0 | 9,302.3 | 12,189.5 | 15,972.9 |
| Total Cash, percent | .0 | .0 | .0 | .0 | .0 | .0 | .0 | .0 | .0 | .0 |
| Account Receivables | 3,110.5 | 5,300.5 | 7,889.8 | 7,915.6 | 6,909.0 | 8,933.8 | 11,706.6 | 15,340.0 | 20,101.1 | 26,340.0 |
| Account Receivables, % | 72.62 | 66.4 | 62.66 | 65.73 | 67.98 | 67.08 | 67.08 | 67.08 | 67.08 | 67.08 |
| Inventories | 1,157.0 | 1,681.4 | 2,463.5 | 3,000.6 | 2,963.0 | 3,242.0 | 4,248.3 | 5,566.8 | 7,294.6 | 9,558.7 |
| Inventories, % | 27.01 | 21.06 | 19.57 | 24.92 | 29.15 | 24.34 | 24.34 | 24.34 | 24.34 | 24.34 |
| Accounts Payable | 1,166.5 | 1,138.0 | 2,329.9 | 2,411.2 | 2,524.5 | 2,793.0 | 3,659.9 | 4,795.9 | 6,284.4 | 8,234.9 |
| Accounts Payable, % | 27.24 | 14.26 | 18.5 | 20.02 | 24.84 | 20.97 | 20.97 | 20.97 | 20.97 | 20.97 |
| Capital Expenditure | -2,668.3 | -3,996.0 | -5,257.8 | -7,823.8 | -2,858.8 | -6,584.9 | -8,628.7 | -11,306.8 | -14,816.1 | -19,414.7 |
| Capital Expenditure, % | -62.3 | -50.06 | -41.76 | -64.97 | -28.13 | -49.44 | -49.44 | -49.44 | -49.44 | -49.44 |
| Tax Rate, % | 34.15 | 34.15 | 34.15 | 34.15 | 34.15 | 34.15 | 34.15 | 34.15 | 34.15 | 34.15 |
| EBITAT | 1,286.1 | 2,900.5 | 4,250.2 | 2,847.3 | -323.8 | 3,047.8 | 3,993.8 | 5,233.3 | 6,857.6 | 8,986.0 |
| Depreciation | ||||||||||
| Changes in Account Receivables | ||||||||||
| Changes in Inventories | ||||||||||
| Changes in Accounts Payable | ||||||||||
| Capital Expenditure | ||||||||||
| UFCF | -3,921.9 | -3,037.3 | -2,117.7 | -3,978.4 | -230.1 | -3,932.0 | -5,397.6 | -7,072.9 | -9,268.1 | -12,144.7 |
| WACC, % | 7.13 | 7.13 | 7.13 | 7.12 | 6.97 | 7.1 | 7.1 | 7.1 | 7.1 | 7.1 |
| PV UFCF | ||||||||||
| SUM PV UFCF | -29,801.4 | |||||||||
| Long Term Growth Rate, % | 3.50 | |||||||||
| Free cash flow (T + 1) | -12,570 | |||||||||
| Terminal Value | -349,575 | |||||||||
| Present Terminal Value | -248,130 | |||||||||
| Enterprise Value | -277,932 | |||||||||
| Net Debt | 11,073 | |||||||||
| Equity Value | -289,005 | |||||||||
| Diluted Shares Outstanding, MM | 962 | |||||||||
| Equity Value Per Share | -300.34 |
What You Will Receive
- Pre-Filled Financial Model: Leverage Yunnan Energy New Material Co., Ltd.'s actual data for accurate DCF valuation.
- Complete Forecast Control: Modify revenue growth, profit margins, WACC, and other key factors.
- Real-Time Calculations: Automatic updates let you view results instantly as you adjust inputs.
- Professional-Grade Template: A polished Excel file crafted for high-caliber valuation.
- Flexible and Reusable: Designed for adaptability, enabling repeated use for comprehensive forecasts.
Key Features
- Real-Life Yunnan Energy Data: Pre-filled with Yunnan Energy New Material Co., Ltd.'s historical financials and forward-looking projections.
- Fully Customizable Inputs: Adjust revenue growth, profit margins, WACC, tax rates, and capital expenditures to suit your analysis.
- Dynamic Valuation Model: Automatic updates to Net Present Value (NPV) and intrinsic value based on your inputs.
- Scenario Testing: Create various forecast scenarios to explore different valuation outcomes.
- User-Friendly Design: Intuitive and structured interface designed for both professionals and newcomers.
How It Functions
- Download the Template: Gain immediate access to the Excel-based Yunnan Energy DCF Calculator.
- Enter Your Assumptions: Modify the yellow-highlighted cells for growth rates, WACC, margins, and other parameters.
- Instant Calculations: The model automatically computes the intrinsic value of Yunnan Energy New Material Co., Ltd. (002812SZ).
- Explore Scenarios: Test various assumptions to assess potential changes in valuation.
- Analyze and Decide: Utilize the outcomes to inform your investment strategy or financial analysis.
Why Choose Yunnan Energy New Material Co., Ltd. (002812SZ) Calculator?
- Precision: Utilizes genuine financial data from Yunnan Energy for optimal accuracy.
- Versatility: Tailored for users to easily adjust and experiment with input parameters.
- Efficiency: Eliminate the need to construct a financial model from the ground up.
- Expert-Level: Crafted with the precision and functionality expected by top finance professionals.
- Accessible: Intuitive design makes it simple for users with varying levels of financial expertise.
Who Can Benefit from This Product?
- Energy Sector Students: Understand material science and apply theoretical knowledge with real-world data.
- Researchers: Integrate advanced models into your studies and analysis of energy materials.
- Investors: Evaluate your investment strategies and analyze market performance for Yunnan Energy New Material Co., Ltd. (002812SZ).
- Industry Analysts: Enhance your analysis process with a customizable model tailored for energy materials.
- Entrepreneurs: Discover the methodologies used in assessing large public companies like Yunnan Energy New Material Co., Ltd. (002812SZ).
What the Template Contains
- Historical Data: Comprises Yunnan Energy New Material Co., Ltd.'s (002812SZ) previous financial performance and foundational forecasts.
- DCF and Levered DCF Models: Comprehensive templates to assess the intrinsic value of Yunnan Energy New Material Co., Ltd. (002812SZ).
- WACC Sheet: Pre-configured calculations for the Weighted Average Cost of Capital.
- Editable Inputs: Adjust essential drivers such as growth rates, EBITDA %, and CAPEX assumptions.
- Quarterly and Annual Statements: An extensive analysis of Yunnan Energy New Material Co., Ltd.'s (002812SZ) financials.
- Interactive Dashboard: Dynamically visualize valuation results and forecasts.
Disclaimer
All information, articles, and product details provided on this website are for general informational and educational purposes only. We do not claim any ownership over, nor do we intend to infringe upon, any trademarks, copyrights, logos, brand names, or other intellectual property mentioned or depicted on this site. Such intellectual property remains the property of its respective owners, and any references here are made solely for identification or informational purposes, without implying any affiliation, endorsement, or partnership.
We make no representations or warranties, express or implied, regarding the accuracy, completeness, or suitability of any content or products presented. Nothing on this website should be construed as legal, tax, investment, financial, medical, or other professional advice. In addition, no part of this site—including articles or product references—constitutes a solicitation, recommendation, endorsement, advertisement, or offer to buy or sell any securities, franchises, or other financial instruments, particularly in jurisdictions where such activity would be unlawful.
All content is of a general nature and may not address the specific circumstances of any individual or entity. It is not a substitute for professional advice or services. Any actions you take based on the information provided here are strictly at your own risk. You accept full responsibility for any decisions or outcomes arising from your use of this website and agree to release us from any liability in connection with your use of, or reliance upon, the content or products found herein.