
|
Shenzhen Yuto Packaging Technology Co., Ltd. (002831.SZ) Valation DCF |
Entièrement Modifiable: Adapté À Vos Besoins Dans Excel Ou Sheets
Conception Professionnelle: Modèles Fiables Et Conformes Aux Normes Du Secteur
Pré-Construits Pour Une Utilisation Rapide Et Efficace
Compatible MAC/PC, entièrement débloqué
Aucune Expertise N'Est Requise; Facile À Suivre
ShenZhen YUTO Packaging Technology Co., Ltd. (002831.SZ) Bundle
Maîtrisez votre Shenzhen Yuto Packaging Technology Co., Ltd. (002831SZ) Analyse d'évaluation à l'aide de notre calculatrice DCF de pointe! Ce modèle Excel est préchargé avec des données précises (002831SZ), vous permettant d'ajuster les prévisions et les hypothèses pour déterminer la valeur intrinsèque de Shenzhen Yuto Packaging Technology Co., Ltd. avec précision.
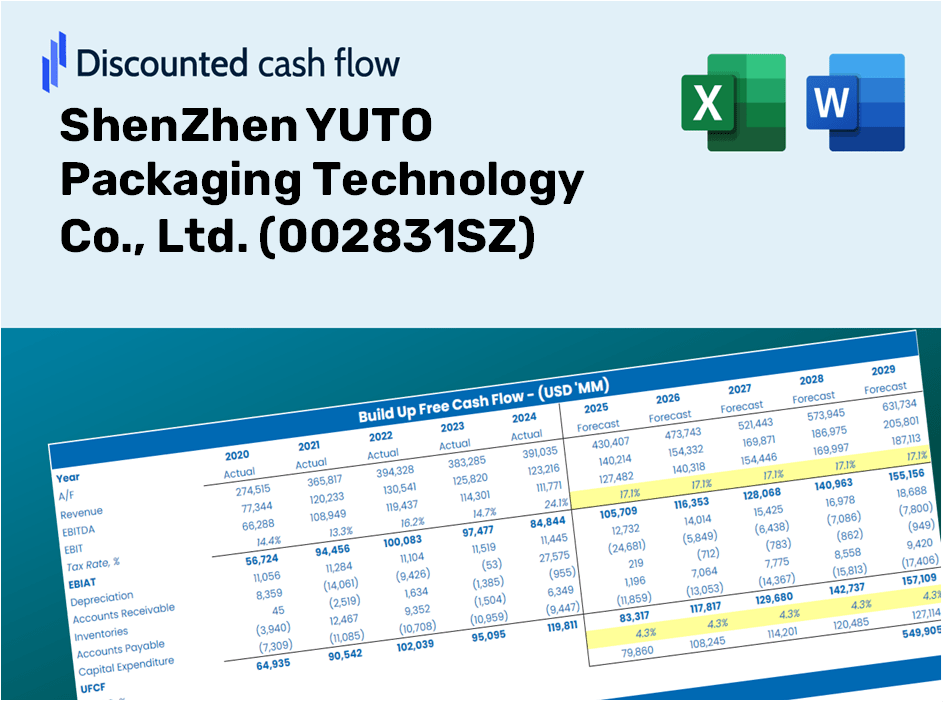
Discounted Cash Flow (DCF) - (USD MM)
| Year | AY1 2020 |
AY2 2021 |
AY3 2022 |
AY4 2023 |
AY5 2024 |
FY1 2025 |
FY2 2026 |
FY3 2027 |
FY4 2028 |
FY5 2029 |
|---|---|---|---|---|---|---|---|---|---|---|
| Revenue | 11,788.9 | 14,943.6 | 16,362.1 | 15,222.7 | 17,156.9 | 18,958.2 | 20,948.5 | 23,147.8 | 25,578.1 | 28,263.4 |
| Revenue Growth, % | 0 | 26.76 | 9.49 | -6.96 | 12.71 | 10.5 | 10.5 | 10.5 | 10.5 | 10.5 |
| EBITDA | 1,869.7 | 1,784.9 | 2,349.6 | 2,441.2 | 2,424.4 | 2,742.6 | 3,030.5 | 3,348.6 | 3,700.2 | 4,088.7 |
| EBITDA, % | 15.86 | 11.94 | 14.36 | 16.04 | 14.13 | 14.47 | 14.47 | 14.47 | 14.47 | 14.47 |
| Depreciation | 435.7 | 497.3 | 544.3 | 596.3 | 599.8 | 673.5 | 744.3 | 822.4 | 908.7 | 1,004.1 |
| Depreciation, % | 3.7 | 3.33 | 3.33 | 3.92 | 3.5 | 3.55 | 3.55 | 3.55 | 3.55 | 3.55 |
| EBIT | 1,434.0 | 1,287.6 | 1,805.3 | 1,844.9 | 1,824.6 | 2,069.0 | 2,286.2 | 2,526.3 | 2,791.5 | 3,084.5 |
| EBIT, % | 12.16 | 8.62 | 11.03 | 12.12 | 10.63 | 10.91 | 10.91 | 10.91 | 10.91 | 10.91 |
| Total Cash | 2,851.3 | 2,817.3 | 3,538.1 | 4,373.1 | 4,060.5 | 4,438.4 | 4,904.4 | 5,419.3 | 5,988.2 | 6,616.9 |
| Total Cash, percent | .0 | .0 | .0 | .0 | .0 | .0 | .0 | .0 | .0 | .0 |
| Account Receivables | 5,476.4 | 5,877.2 | 6,347.8 | 5,963.9 | 6,758.5 | 7,702.6 | 8,511.3 | 9,404.9 | 10,392.3 | 11,483.3 |
| Account Receivables, % | 46.45 | 39.33 | 38.8 | 39.18 | 39.39 | 40.63 | 40.63 | 40.63 | 40.63 | 40.63 |
| Inventories | 1,518.3 | 1,779.1 | 1,766.4 | 1,619.2 | 1,748.9 | 2,138.9 | 2,363.4 | 2,611.5 | 2,885.7 | 3,188.7 |
| Inventories, % | 12.88 | 11.91 | 10.8 | 10.64 | 10.19 | 11.28 | 11.28 | 11.28 | 11.28 | 11.28 |
| Accounts Payable | 2,653.5 | 2,597.4 | 3,020.5 | 3,779.3 | 3,841.0 | 4,002.6 | 4,422.9 | 4,887.2 | 5,400.3 | 5,967.2 |
| Accounts Payable, % | 22.51 | 17.38 | 18.46 | 24.83 | 22.39 | 21.11 | 21.11 | 21.11 | 21.11 | 21.11 |
| Capital Expenditure | -1,709.2 | -1,851.9 | -1,602.2 | -1,169.0 | -978.3 | -1,898.3 | -2,097.6 | -2,317.8 | -2,561.1 | -2,830.0 |
| Capital Expenditure, % | -14.5 | -12.39 | -9.79 | -7.68 | -5.7 | -10.01 | -10.01 | -10.01 | -10.01 | -10.01 |
| Tax Rate, % | 18.87 | 18.87 | 18.87 | 18.87 | 18.87 | 18.87 | 18.87 | 18.87 | 18.87 | 18.87 |
| EBITAT | 1,205.4 | 1,082.3 | 1,487.6 | 1,499.6 | 1,480.3 | 1,708.7 | 1,888.1 | 2,086.4 | 2,305.4 | 2,547.4 |
| Depreciation | ||||||||||
| Changes in Account Receivables | ||||||||||
| Changes in Inventories | ||||||||||
| Changes in Accounts Payable | ||||||||||
| Capital Expenditure | ||||||||||
| UFCF | -4,409.3 | -989.8 | 394.8 | 2,216.9 | 239.2 | -688.5 | -78.2 | -86.4 | -95.5 | -105.5 |
| WACC, % | 4.83 | 4.83 | 4.82 | 4.82 | 4.82 | 4.83 | 4.83 | 4.83 | 4.83 | 4.83 |
| PV UFCF | ||||||||||
| SUM PV UFCF | -965.4 | |||||||||
| Long Term Growth Rate, % | 3.00 | |||||||||
| Free cash flow (T + 1) | -109 | |||||||||
| Terminal Value | -5,953 | |||||||||
| Present Terminal Value | -4,704 | |||||||||
| Enterprise Value | -5,669 | |||||||||
| Net Debt | 2,135 | |||||||||
| Equity Value | -7,804 | |||||||||
| Diluted Shares Outstanding, MM | 915 | |||||||||
| Equity Value Per Share | -8.53 |
Benefits You Will Receive
- Pre-Configured Financial Model: Leverage ShenZhen YUTO's actual data for accurate DCF valuation.
- Complete Forecast Control: Modify revenue growth, profit margins, WACC, and other critical variables.
- Real-Time Calculations: Instantaneous updates allow you to view results as changes are made.
- Professional-Grade Template: A polished Excel file crafted for high-quality valuation.
- Flexible and Reusable: Designed for adaptability, ensuring consistent use for comprehensive forecasts.
Key Features
- Real-Time YUTO Data: Pre-loaded with ShenZhen YUTO Packaging Technology Co., Ltd.'s historical financial performance and future forecasts.
- Customizable Parameters: Modify revenue growth rates, profit margins, discount rates, tax rates, and capital expenditures to fit your analysis.
- Adaptive Valuation Model: Automatic recalculations of Net Present Value (NPV) and intrinsic value in response to your adjustments.
- Scenario Analysis: Develop various forecasting scenarios to explore diverse valuation possibilities.
- Intuitive Interface: Designed for ease of use, catering to both industry professionals and those new to financial analysis.
How It Works
- Step 1: Download the Excel file.
- Step 2: Examine the pre-filled data for ShenZhen YUTO Packaging Technology Co., Ltd. (002831SZ), including historical and projected figures.
- Step 3: Modify key assumptions (marked in yellow cells) according to your analysis.
- Step 4: Observe the automatic updates for ShenZhen YUTO's intrinsic value.
- Step 5: Utilize the results for your investment strategies or reporting needs.
Why Choose YUTO's Packaging Solutions?
- Quality: Premium materials ensure the durability and reliability of our packaging.
- Customization: Tailored solutions to meet the unique needs of your business.
- Efficiency: Streamline your packaging process and reduce turnaround times.
- Industry Expertise: Designed with insights from leading experts in packaging technology.
- User-Focused: Intuitive designs that simplify the user experience for all clients.
Who Can Benefit from Our Solutions?
- Packaging Professionals: Discover innovative packaging solutions tailored to your needs.
- Manufacturers: Integrate advanced packaging technology into your production processes.
- Retailers: Enhance your product presentation with unique packaging designs.
- Investors: Analyze market trends and assess the value of investments in ShenZhen YUTO Packaging Technology Co., Ltd. (002831SZ).
- Small Business Owners: Learn about effective packaging strategies used by leading companies in the industry.
Overview of Template Features
- Operating and Balance Sheet Data: Pre-filled historical financial data and forecasts for ShenZhen YUTO Packaging Technology Co., Ltd. (002831SZ), including revenue, EBITDA, EBIT, and capital expenditures.
- WACC Calculation: A dedicated worksheet for calculating the Weighted Average Cost of Capital (WACC), featuring essential parameters such as Beta, risk-free rate, and share price.
- DCF Valuation (Unlevered and Levered): Customizable Discounted Cash Flow models that provide intrinsic value estimates along with comprehensive calculations.
- Financial Statements: Pre-loaded annual and quarterly financial statements to facilitate thorough analysis.
- Key Ratios: A collection of profitability, leverage, and efficiency ratios specifically for ShenZhen YUTO Packaging Technology Co., Ltd. (002831SZ).
- Dashboard and Charts: A visual representation of valuation outputs and assumptions, designed for easy result analysis.
Disclaimer
All information, articles, and product details provided on this website are for general informational and educational purposes only. We do not claim any ownership over, nor do we intend to infringe upon, any trademarks, copyrights, logos, brand names, or other intellectual property mentioned or depicted on this site. Such intellectual property remains the property of its respective owners, and any references here are made solely for identification or informational purposes, without implying any affiliation, endorsement, or partnership.
We make no representations or warranties, express or implied, regarding the accuracy, completeness, or suitability of any content or products presented. Nothing on this website should be construed as legal, tax, investment, financial, medical, or other professional advice. In addition, no part of this site—including articles or product references—constitutes a solicitation, recommendation, endorsement, advertisement, or offer to buy or sell any securities, franchises, or other financial instruments, particularly in jurisdictions where such activity would be unlawful.
All content is of a general nature and may not address the specific circumstances of any individual or entity. It is not a substitute for professional advice or services. Any actions you take based on the information provided here are strictly at your own risk. You accept full responsibility for any decisions or outcomes arising from your use of this website and agree to release us from any liability in connection with your use of, or reliance upon, the content or products found herein.