
|
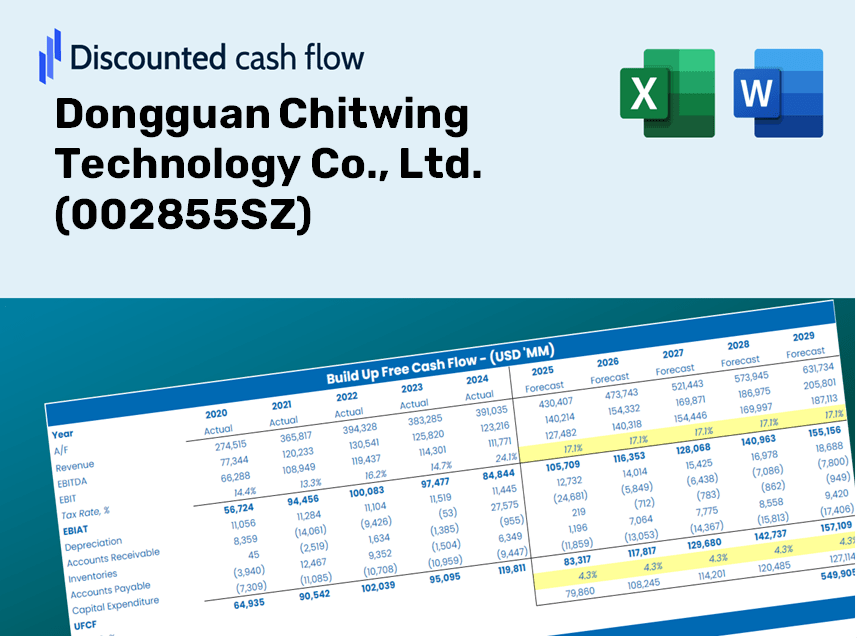
Dongguan Chitwing Technology Co., Ltd. (002855.SZ) Valation DCF |
Entièrement Modifiable: Adapté À Vos Besoins Dans Excel Ou Sheets
Conception Professionnelle: Modèles Fiables Et Conformes Aux Normes Du Secteur
Pré-Construits Pour Une Utilisation Rapide Et Efficace
Compatible MAC/PC, entièrement débloqué
Aucune Expertise N'Est Requise; Facile À Suivre
Dongguan Chitwing Technology Co., Ltd. (002855.SZ) Bundle
Vous cherchez à déterminer la valeur intrinsèque de Dongguan Chitwing Technology Co., Ltd.? Notre calculatrice DCF (002855SZ) intègre des données réelles avec des fonctionnalités de personnalisation étendues, vous permettant d'affiner vos prévisions et d'améliorer vos stratégies d'investissement.
Discounted Cash Flow (DCF) - (USD MM)
| Year | AY1 2020 |
AY2 2021 |
AY3 2022 |
AY4 2023 |
AY5 2024 |
FY1 2025 |
FY2 2026 |
FY3 2027 |
FY4 2028 |
FY5 2029 |
|---|---|---|---|---|---|---|---|---|---|---|
| Revenue | 2,822.9 | 3,091.8 | 2,697.9 | 1,767.4 | 1,356.5 | 1,149.8 | 974.6 | 826.1 | 700.2 | 593.5 |
| Revenue Growth, % | 0 | 9.52 | -12.74 | -34.49 | -23.25 | -15.24 | -15.24 | -15.24 | -15.24 | -15.24 |
| EBITDA | 239.6 | -90.1 | 71.2 | 31.3 | -146.5 | -1.9 | -1.6 | -1.3 | -1.1 | -1.0 |
| EBITDA, % | 8.49 | -2.91 | 2.64 | 1.77 | -10.8 | -0.16211 | -0.16211 | -0.16211 | -0.16211 | -0.16211 |
| Depreciation | 125.6 | 164.9 | 181.7 | 130.8 | 132.5 | 77.5 | 65.7 | 55.7 | 47.2 | 40.0 |
| Depreciation, % | 4.45 | 5.33 | 6.73 | 7.4 | 9.77 | 6.74 | 6.74 | 6.74 | 6.74 | 6.74 |
| EBIT | 114.0 | -255.0 | -110.5 | -99.5 | -279.0 | -79.3 | -67.2 | -57.0 | -48.3 | -41.0 |
| EBIT, % | 4.04 | -8.25 | -4.1 | -5.63 | -20.57 | -6.9 | -6.9 | -6.9 | -6.9 | -6.9 |
| Total Cash | 360.4 | 389.9 | 251.7 | 243.0 | 67.9 | 122.9 | 104.2 | 88.3 | 74.9 | 63.5 |
| Total Cash, percent | .0 | .0 | .0 | .0 | .0 | .0 | .0 | .0 | .0 | .0 |
| Account Receivables | 753.3 | 622.6 | 627.4 | 371.5 | 435.1 | 283.3 | 240.1 | 203.5 | 172.5 | 146.2 |
| Account Receivables, % | 26.68 | 20.14 | 23.25 | 21.02 | 32.08 | 24.63 | 24.63 | 24.63 | 24.63 | 24.63 |
| Inventories | 616.5 | 347.4 | 311.0 | 185.1 | 247.8 | 168.7 | 143.0 | 121.2 | 102.7 | 87.1 |
| Inventories, % | 21.84 | 11.24 | 11.53 | 10.47 | 18.26 | 14.67 | 14.67 | 14.67 | 14.67 | 14.67 |
| Accounts Payable | 1,184.8 | 1,181.3 | 987.4 | 384.9 | 603.7 | 421.0 | 356.8 | 302.4 | 256.4 | 217.3 |
| Accounts Payable, % | 41.97 | 38.21 | 36.6 | 21.78 | 44.51 | 36.61 | 36.61 | 36.61 | 36.61 | 36.61 |
| Capital Expenditure | -127.0 | -178.8 | -158.8 | -64.4 | -38.8 | -52.1 | -44.2 | -37.5 | -31.7 | -26.9 |
| Capital Expenditure, % | -4.5 | -5.78 | -5.89 | -3.64 | -2.86 | -4.53 | -4.53 | -4.53 | -4.53 | -4.53 |
| Tax Rate, % | 2.01 | 2.01 | 2.01 | 2.01 | 2.01 | 2.01 | 2.01 | 2.01 | 2.01 | 2.01 |
| EBITAT | 111.7 | -239.4 | -120.3 | -99.7 | -273.4 | -77.7 | -65.9 | -55.8 | -47.3 | -40.1 |
| Depreciation | ||||||||||
| Changes in Account Receivables | ||||||||||
| Changes in Inventories | ||||||||||
| Changes in Accounts Payable | ||||||||||
| Capital Expenditure | ||||||||||
| UFCF | -74.7 | 143.0 | -259.5 | -254.1 | -87.0 | -4.2 | -39.7 | -33.6 | -28.5 | -24.2 |
| WACC, % | 4.87 | 4.84 | 4.88 | 4.88 | 4.87 | 4.87 | 4.87 | 4.87 | 4.87 | 4.87 |
| PV UFCF | ||||||||||
| SUM PV UFCF | -111.9 | |||||||||
| Long Term Growth Rate, % | 4.00 | |||||||||
| Free cash flow (T + 1) | -25 | |||||||||
| Terminal Value | -2,893 | |||||||||
| Present Terminal Value | -2,281 | |||||||||
| Enterprise Value | -2,393 | |||||||||
| Net Debt | 177 | |||||||||
| Equity Value | -2,570 | |||||||||
| Diluted Shares Outstanding, MM | 246 | |||||||||
| Equity Value Per Share | -10.43 |
What You Will Receive
- Customizable Excel Template: A complete Excel-based DCF Calculator featuring pre-filled financial data for Dongguan Chitwing Technology Co., Ltd. (002855SZ).
- Insightful Data: Access to historical performance metrics and future projections (highlighted in the yellow cells).
- Assumption Flexibility: Adjust forecast variables such as revenue growth, EBITDA %, and WACC as needed.
- Instant Calculations: Quickly observe how your inputs affect the valuation of Dongguan Chitwing Technology Co., Ltd. (002855SZ).
- Professional-Grade Tool: Designed for investors, CFOs, consultants, and financial analysts.
- User-Centric Design: Organized for simplicity and usability, complete with step-by-step guidance.
Key Features
- Pre-Loaded Data: Dongguan Chitwing Technology Co., Ltd.'s historical financial statements and pre-filled forecasts.
- Fully Adjustable Inputs: Customize WACC, tax rates, revenue growth, and EBITDA margins as needed.
- Instant Results: Observe the intrinsic value of Dongguan Chitwing Technology Co., Ltd. recalculating in real time.
- Clear Visual Outputs: Dashboard charts showcase valuation results and essential metrics.
- Built for Accuracy: A professional-grade tool designed for analysts, investors, and finance professionals.
How It Works
- Step 1: Download the Excel file.
- Step 2: Review Dongguan Chitwing Technology Co., Ltd.'s [Symbol] pre-filled financial data and forecasts.
- Step 3: Adjust key inputs such as revenue growth, WACC, and tax rates (highlighted cells).
- Step 4: Observe the DCF model update in real-time as you modify your assumptions.
- Step 5: Evaluate the outputs and apply the findings to inform your investment decisions.
Why Choose Dongguan Chitwing Technology Co., Ltd. (002855SZ)?
- Precision: Comprehensive financial data guarantees high accuracy.
- Adaptability: Users can easily experiment with and adjust inputs to fit their needs.
- Efficiency: Eliminate the complexities of constructing a financial model from the ground up.
- Expert-Level: Crafted with the expertise and practicality expected by CFOs.
- Intuitive: Simple interface designed for users of all skill levels in financial modeling.
Who Can Benefit from This Product?
- Investors: Evaluate Dongguan Chitwing Technology Co., Ltd.'s (002855SZ) market valuation before making investment decisions.
- CFOs and Financial Analysts: Enhance valuation accuracy and validate financial projections for informed decision-making.
- Startup Founders: Understand how successful public companies like Dongguan Chitwing Technology Co., Ltd. (002855SZ) are appraised.
- Consultants: Create comprehensive valuation reports to provide insights for clients.
- Students and Educators: Utilize real-time data to practice and educate on effective valuation strategies.
Contents of the Template
- Preloaded 002855SZ Data: Historical and projected financial metrics, including revenue, EBIT, and capital expenditures.
- DCF and WACC Models: Professional-grade spreadsheets to determine intrinsic value and Weighted Average Cost of Capital.
- Editable Inputs: Cells highlighted in yellow for modifying revenue growth, tax rates, and discount rates.
- Financial Statements: Detailed annual and quarterly financial reports for in-depth analysis.
- Key Ratios: Ratios for profitability, leverage, and efficiency to assess performance.
- Dashboard and Charts: Visual representations of valuation results and underlying assumptions.
Disclaimer
All information, articles, and product details provided on this website are for general informational and educational purposes only. We do not claim any ownership over, nor do we intend to infringe upon, any trademarks, copyrights, logos, brand names, or other intellectual property mentioned or depicted on this site. Such intellectual property remains the property of its respective owners, and any references here are made solely for identification or informational purposes, without implying any affiliation, endorsement, or partnership.
We make no representations or warranties, express or implied, regarding the accuracy, completeness, or suitability of any content or products presented. Nothing on this website should be construed as legal, tax, investment, financial, medical, or other professional advice. In addition, no part of this site—including articles or product references—constitutes a solicitation, recommendation, endorsement, advertisement, or offer to buy or sell any securities, franchises, or other financial instruments, particularly in jurisdictions where such activity would be unlawful.
All content is of a general nature and may not address the specific circumstances of any individual or entity. It is not a substitute for professional advice or services. Any actions you take based on the information provided here are strictly at your own risk. You accept full responsibility for any decisions or outcomes arising from your use of this website and agree to release us from any liability in connection with your use of, or reliance upon, the content or products found herein.