
|
Hainan Drinda Automotive Trim Co., Ltd (002865.SZ) Valation DCF |
Entièrement Modifiable: Adapté À Vos Besoins Dans Excel Ou Sheets
Conception Professionnelle: Modèles Fiables Et Conformes Aux Normes Du Secteur
Pré-Construits Pour Une Utilisation Rapide Et Efficace
Compatible MAC/PC, entièrement débloqué
Aucune Expertise N'Est Requise; Facile À Suivre
Hainan Drinda Automotive Trim Co., Ltd (002865.SZ) Bundle
Améliorez vos stratégies d'investissement avec la calculatrice DCF (002865SZ)! Explorez de véritables données financières de Hainan Drinda Automotive Trim Co., Ltd, ajustez les projections et dépenses de croissance et observez instantanément comment ces modifications affectent la valeur intrinsèque de (002865SZ).
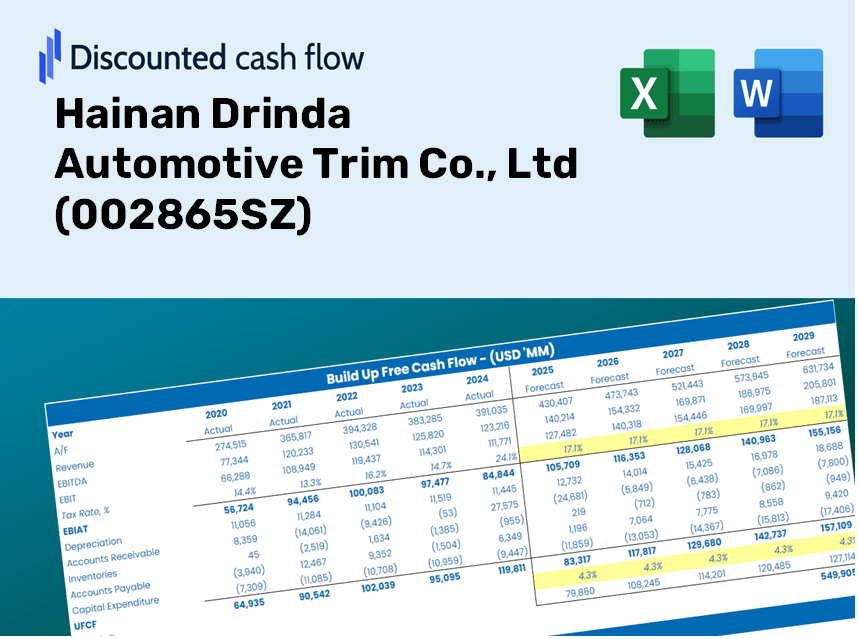
Discounted Cash Flow (DCF) - (USD MM)
| Year | AY1 2020 |
AY2 2021 |
AY3 2022 |
AY4 2023 |
AY5 2024 |
FY1 2025 |
FY2 2026 |
FY3 2027 |
FY4 2028 |
FY5 2029 |
|---|---|---|---|---|---|---|---|---|---|---|
| Revenue | 858.5 | 2,863.4 | 11,595.4 | 18,657.0 | 9,951.9 | 15,282.2 | 23,467.5 | 36,036.7 | 55,338.1 | 84,977.4 |
| Revenue Growth, % | 0 | 233.54 | 304.95 | 60.9 | -46.66 | 53.56 | 53.56 | 53.56 | 53.56 | 53.56 |
| EBITDA | 71.0 | 123.8 | 1,160.5 | 2,377.1 | 174.1 | 1,133.6 | 1,740.8 | 2,673.2 | 4,105.0 | 6,303.6 |
| EBITDA, % | 8.27 | 4.32 | 10.01 | 12.74 | 1.75 | 7.42 | 7.42 | 7.42 | 7.42 | 7.42 |
| Depreciation | 56.7 | 87.4 | 317.2 | 542.6 | 738.8 | 694.4 | 1,066.4 | 1,637.5 | 2,514.6 | 3,861.4 |
| Depreciation, % | 6.6 | 3.05 | 2.74 | 2.91 | 7.42 | 4.54 | 4.54 | 4.54 | 4.54 | 4.54 |
| EBIT | 14.3 | 36.4 | 843.3 | 1,834.5 | -564.7 | 439.2 | 674.4 | 1,035.7 | 1,590.4 | 2,442.2 |
| EBIT, % | 1.67 | 1.27 | 7.27 | 9.83 | -5.67 | 2.87 | 2.87 | 2.87 | 2.87 | 2.87 |
| Total Cash | 333.0 | 491.5 | 1,873.1 | 3,607.9 | 3,965.8 | 4,013.0 | 6,162.4 | 9,462.9 | 14,531.3 | 22,314.3 |
| Total Cash, percent | .0 | .0 | .0 | .0 | .0 | .0 | .0 | .0 | .0 | .0 |
| Account Receivables | 295.4 | 659.3 | 1,069.0 | 1,895.3 | 880.0 | 2,618.0 | 4,020.2 | 6,173.4 | 9,479.9 | 14,557.4 |
| Account Receivables, % | 34.41 | 23.02 | 9.22 | 10.16 | 8.84 | 17.13 | 17.13 | 17.13 | 17.13 | 17.13 |
| Inventories | 189.0 | 437.7 | 338.9 | 727.3 | 552.1 | 1,518.1 | 2,331.2 | 3,579.8 | 5,497.2 | 8,441.5 |
| Inventories, % | 22.01 | 15.29 | 2.92 | 3.9 | 5.55 | 9.93 | 9.93 | 9.93 | 9.93 | 9.93 |
| Accounts Payable | 369.3 | 1,417.0 | 1,536.1 | 3,882.7 | 3,475.2 | 4,935.6 | 7,579.1 | 11,638.5 | 17,872.1 | 27,444.4 |
| Accounts Payable, % | 43.02 | 49.49 | 13.25 | 20.81 | 34.92 | 32.3 | 32.3 | 32.3 | 32.3 | 32.3 |
| Capital Expenditure | -119.6 | -154.1 | -525.4 | -2,780.9 | -443.6 | -1,320.8 | -2,028.1 | -3,114.4 | -4,782.5 | -7,344.1 |
| Capital Expenditure, % | -13.94 | -5.38 | -4.53 | -14.91 | -4.46 | -8.64 | -8.64 | -8.64 | -8.64 | -8.64 |
| Tax Rate, % | 19.18 | 19.18 | 19.18 | 19.18 | 19.18 | 19.18 | 19.18 | 19.18 | 19.18 | 19.18 |
| EBITAT | 12.7 | 64.3 | 678.0 | 2,009.8 | -456.4 | 395.5 | 607.3 | 932.6 | 1,432.0 | 2,199.0 |
| Depreciation | ||||||||||
| Changes in Account Receivables | ||||||||||
| Changes in Inventories | ||||||||||
| Changes in Accounts Payable | ||||||||||
| Capital Expenditure | ||||||||||
| UFCF | -165.3 | 432.7 | 278.0 | 903.5 | 622.0 | -1,474.6 | 73.7 | 113.2 | 173.8 | 266.9 |
| WACC, % | 4.8 | 4.99 | 4.65 | 4.99 | 4.65 | 4.82 | 4.82 | 4.82 | 4.82 | 4.82 |
| PV UFCF | ||||||||||
| SUM PV UFCF | -886.4 | |||||||||
| Long Term Growth Rate, % | 3.50 | |||||||||
| Free cash flow (T + 1) | 276 | |||||||||
| Terminal Value | 21,002 | |||||||||
| Present Terminal Value | 16,601 | |||||||||
| Enterprise Value | 15,714 | |||||||||
| Net Debt | 123 | |||||||||
| Equity Value | 15,592 | |||||||||
| Diluted Shares Outstanding, MM | 227 | |||||||||
| Equity Value Per Share | 68.56 |
What You Will Receive
- Customizable Excel Template: A comprehensive Excel-based DCF Calculator featuring pre-filled financial data for Hainan Drinda Automotive Trim Co., Ltd (002865SZ).
- Accurate Data: Access to historical data and forward-looking projections (highlighted in the yellow cells).
- Flexible Forecasting: Adjust key assumptions such as revenue growth, EBITDA %, and WACC to tailor your analysis.
- Instant Calculations: Observe the effects of your inputs on the valuation of Hainan Drinda Automotive Trim Co., Ltd (002865SZ) in real-time.
- Professional Resource: Designed for investors, CFOs, consultants, and financial analysts alike.
- Intuitive Layout: Organized for straightforward navigation, complete with step-by-step guidance.
Key Features
- Comprehensive DCF Calculator: Offers detailed unlevered and levered DCF valuation frameworks tailored for Hainan Drinda Automotive Trim Co., Ltd (002865SZ).
- WACC Calculator: An integrated Weighted Average Cost of Capital tool with customizable variables to suit your analysis.
- Customizable Forecast Inputs: Adjust projections for growth rates, capital expenditures, and discount rates as needed.
- Integrated Financial Ratios: Evaluate profitability, leverage, and operational efficiency ratios specifically for Hainan Drinda Automotive Trim Co., Ltd (002865SZ).
- Visual Dashboard and Charts: Graphical representations provide a clear overview of essential valuation metrics for streamlined analysis.
How It Functions
- Step 1: Download the Excel spreadsheet.
- Step 2: Examine the pre-filled data for Hainan Drinda Automotive Trim Co., Ltd (002865SZ) (historical and projected).
- Step 3: Modify key assumptions (marked in yellow) based on your insights.
- Step 4: Observe the automatic updates for the intrinsic value of Hainan Drinda Automotive Trim Co., Ltd (002865SZ).
- Step 5: Utilize the results for investment decisions or reporting purposes.
Why Opt for Hainan Drinda Automotive Trim Co., Ltd (002865SZ) Calculator?
- Precision: Accurate data derived from Hainan Drinda’s financial reports.
- Adaptability: Tailored for users to easily customize and explore different inputs.
- Efficiency: Eliminate the complexities of constructing a financial model from the ground up.
- Expert-Level: Designed with a focus on the standards and usability expected by CFOs.
- User-Friendly: Intuitive interface suitable for individuals without extensive financial modeling skills.
Who Can Benefit from Our Products?
- Automotive Industry Professionals: Develop precise and reliable models for evaluating automotive components.
- Corporate Finance Teams: Assess valuation scenarios to inform company strategy and investment decisions.
- Consultants and Advisors: Deliver accurate valuation insights for Hainan Drinda Automotive Trim Co., Ltd (002865SZ) to your clients.
- Students and Educators: Utilize real-world data to enhance learning and practice in financial modeling and analysis.
- Automotive Enthusiasts: Gain insights into the valuation processes of leading automotive suppliers like Hainan Drinda Automotive Trim Co., Ltd (002865SZ).
Contents of the Template
- Operating and Balance Sheet Data: Pre-filled historical data and forecasts for Hainan Drinda Automotive Trim Co., Ltd (002865SZ), covering revenue, EBITDA, EBIT, and capital expenditures.
- WACC Calculation: A dedicated sheet for calculating the Weighted Average Cost of Capital (WACC), including key factors such as Beta, risk-free rate, and share price.
- DCF Valuation (Unlevered and Levered): Customizable Discounted Cash Flow models that illustrate intrinsic value with comprehensive calculations.
- Financial Statements: Pre-loaded annual and quarterly financial statements to facilitate in-depth analysis.
- Key Ratios: Provides essential profitability, leverage, and efficiency ratios for Hainan Drinda Automotive Trim Co., Ltd (002865SZ).
- Dashboard and Charts: A visual representation of valuation outputs and assumptions, designed for straightforward result analysis.
Disclaimer
All information, articles, and product details provided on this website are for general informational and educational purposes only. We do not claim any ownership over, nor do we intend to infringe upon, any trademarks, copyrights, logos, brand names, or other intellectual property mentioned or depicted on this site. Such intellectual property remains the property of its respective owners, and any references here are made solely for identification or informational purposes, without implying any affiliation, endorsement, or partnership.
We make no representations or warranties, express or implied, regarding the accuracy, completeness, or suitability of any content or products presented. Nothing on this website should be construed as legal, tax, investment, financial, medical, or other professional advice. In addition, no part of this site—including articles or product references—constitutes a solicitation, recommendation, endorsement, advertisement, or offer to buy or sell any securities, franchises, or other financial instruments, particularly in jurisdictions where such activity would be unlawful.
All content is of a general nature and may not address the specific circumstances of any individual or entity. It is not a substitute for professional advice or services. Any actions you take based on the information provided here are strictly at your own risk. You accept full responsibility for any decisions or outcomes arising from your use of this website and agree to release us from any liability in connection with your use of, or reliance upon, the content or products found herein.