
|
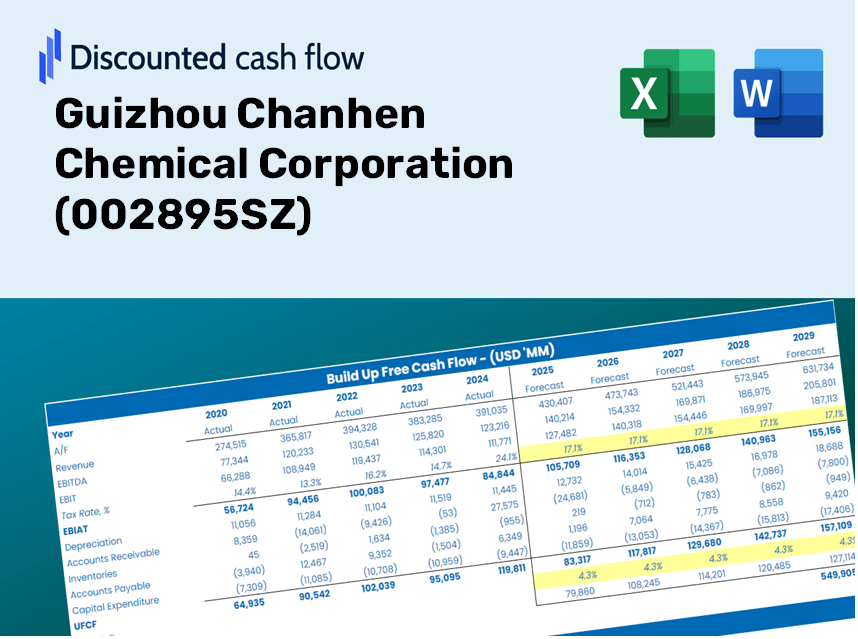
Guizhou Chanhen Chemical Corporation (002895.SZ) Évaluation DCF |
Entièrement Modifiable: Adapté À Vos Besoins Dans Excel Ou Sheets
Conception Professionnelle: Modèles Fiables Et Conformes Aux Normes Du Secteur
Pré-Construits Pour Une Utilisation Rapide Et Efficace
Compatible MAC/PC, entièrement débloqué
Aucune Expertise N'Est Requise; Facile À Suivre
Guizhou Chanhen Chemical Corporation (002895.SZ) Bundle
Conçu pour la précision, notre calculatrice DCF (002895SZ) vous permet d'évaluer l'évaluation de Guizhou Chanhen Chemical Corporation à l'aide de données financières réelles, offrant une flexibilité complète pour modifier tous les paramètres clés pour des projections améliorées.
Discounted Cash Flow (DCF) - (USD MM)
| Year | AY1 2020 |
AY2 2021 |
AY3 2022 |
AY4 2023 |
AY5 2024 |
FY1 2025 |
FY2 2026 |
FY3 2027 |
FY4 2028 |
FY5 2029 |
|---|---|---|---|---|---|---|---|---|---|---|
| Revenue | 1,777.3 | 2,530.1 | 3,447.5 | 4,319.5 | 5,905.6 | 7,982.0 | 10,788.3 | 14,581.3 | 19,707.9 | 26,636.9 |
| Revenue Growth, % | 0 | 42.36 | 36.26 | 25.3 | 36.72 | 35.16 | 35.16 | 35.16 | 35.16 | 35.16 |
| EBITDA | 258.1 | 569.2 | 1,225.3 | 1,423.7 | 1,712.0 | 2,147.4 | 2,902.3 | 3,922.8 | 5,301.9 | 7,166.0 |
| EBITDA, % | 14.53 | 22.5 | 35.54 | 32.96 | 28.99 | 26.9 | 26.9 | 26.9 | 26.9 | 26.9 |
| Depreciation | 85.0 | 109.7 | 160.6 | 298.0 | 407.8 | 440.3 | 595.2 | 804.4 | 1,087.2 | 1,469.5 |
| Depreciation, % | 4.78 | 4.33 | 4.66 | 6.9 | 6.91 | 5.52 | 5.52 | 5.52 | 5.52 | 5.52 |
| EBIT | 173.1 | 459.6 | 1,064.7 | 1,125.7 | 1,304.1 | 1,707.0 | 2,307.2 | 3,118.4 | 4,214.7 | 5,696.6 |
| EBIT, % | 9.74 | 18.16 | 30.88 | 26.06 | 22.08 | 21.39 | 21.39 | 21.39 | 21.39 | 21.39 |
| Total Cash | 1,063.7 | 1,479.7 | 1,520.7 | 2,249.1 | 2,012.5 | 3,968.5 | 5,363.8 | 7,249.6 | 9,798.4 | 13,243.4 |
| Total Cash, percent | .0 | .0 | .0 | .0 | .0 | .0 | .0 | .0 | .0 | .0 |
| Account Receivables | 236.9 | 465.4 | 483.3 | 848.0 | 862.3 | 1,276.8 | 1,725.7 | 2,332.4 | 3,152.4 | 4,260.8 |
| Account Receivables, % | 13.33 | 18.4 | 14.02 | 19.63 | 14.6 | 16 | 16 | 16 | 16 | 16 |
| Inventories | 258.0 | 350.6 | 792.2 | 776.3 | 884.5 | 1,345.9 | 1,819.0 | 2,458.6 | 3,323.0 | 4,491.3 |
| Inventories, % | 14.52 | 13.86 | 22.98 | 17.97 | 14.98 | 16.86 | 16.86 | 16.86 | 16.86 | 16.86 |
| Accounts Payable | 143.1 | 333.3 | 744.2 | 1,060.3 | 944.2 | 1,330.5 | 1,798.3 | 2,430.6 | 3,285.1 | 4,440.1 |
| Accounts Payable, % | 8.05 | 13.17 | 21.59 | 24.55 | 15.99 | 16.67 | 16.67 | 16.67 | 16.67 | 16.67 |
| Capital Expenditure | -165.0 | -1,917.8 | -1,804.7 | -803.7 | -451.9 | -2,613.2 | -3,531.9 | -4,773.7 | -6,452.0 | -8,720.5 |
| Capital Expenditure, % | -9.29 | -75.8 | -52.35 | -18.61 | -7.65 | -32.74 | -32.74 | -32.74 | -32.74 | -32.74 |
| Tax Rate, % | 18.46 | 18.46 | 18.46 | 18.46 | 18.46 | 18.46 | 18.46 | 18.46 | 18.46 | 18.46 |
| EBITAT | 139.3 | 387.7 | 855.1 | 893.2 | 1,063.4 | 1,386.2 | 1,873.5 | 2,532.2 | 3,422.5 | 4,625.8 |
| Depreciation | ||||||||||
| Changes in Account Receivables | ||||||||||
| Changes in Inventories | ||||||||||
| Changes in Accounts Payable | ||||||||||
| Capital Expenditure | ||||||||||
| UFCF | -292.6 | -1,551.4 | -837.5 | 354.9 | 780.6 | -1,276.1 | -1,517.5 | -2,051.1 | -2,772.2 | -3,746.8 |
| WACC, % | 5.62 | 5.64 | 5.61 | 5.61 | 5.62 | 5.62 | 5.62 | 5.62 | 5.62 | 5.62 |
| PV UFCF | ||||||||||
| SUM PV UFCF | -9,387.3 | |||||||||
| Long Term Growth Rate, % | 0.50 | |||||||||
| Free cash flow (T + 1) | -3,766 | |||||||||
| Terminal Value | -73,539 | |||||||||
| Present Terminal Value | -55,947 | |||||||||
| Enterprise Value | -65,334 | |||||||||
| Net Debt | 1,351 | |||||||||
| Equity Value | -66,685 | |||||||||
| Diluted Shares Outstanding, MM | 562 | |||||||||
| Equity Value Per Share | -118.56 |
What You Will Receive
- Genuine (002895SZ) Financials: Access to both historical and projected data for precise valuation.
- Customizable Inputs: Adjust WACC, tax rates, revenue growth, and capital expenditures as needed.
- Real-Time Calculations: Intrinsic value and NPV are updated automatically.
- Scenario Simulation: Explore various scenarios to assess Guizhou Chanhen Chemical Corporation's future performance.
- User-Friendly Design: Crafted for industry experts while remaining easy to use for novices.
Key Features
- Current Guizhou Chanhen Data: Pre-populated with the company’s historical financial data and future projections.
- Completely Customizable Variables: Tailor revenue growth rates, profit margins, WACC, tax assumptions, and capital investment plans.
- Adaptive Valuation Model: Automatic recalculations of Net Present Value (NPV) and intrinsic value based on your customized inputs.
- Scenario Analysis: Develop various forecasting scenarios to evaluate different valuation possibilities.
- Intuitive Interface: Designed to be straightforward and accessible for both seasoned professionals and newcomers.
How It Functions
- Download: Obtain the pre-configured Excel file containing Guizhou Chanhen Chemical Corporation's (002895SZ) financial data.
- Customize: Modify forecasts such as revenue growth, EBITDA %, and WACC as needed.
- Real-Time Updates: The intrinsic value and NPV calculations refresh automatically as you make changes.
- Scenario Testing: Generate various projections and instantly compare their results.
- Informed Decisions: Utilize the valuation insights to shape your investment approach.
Why Choose This Calculator for Guizhou Chanhen Chemical Corporation (002895SZ)?
- User-Friendly Interface: Perfectly tailored for both novice and seasoned users.
- Customizable Inputs: Effortlessly adjust variables to suit your analysis needs.
- Real-Time Calculations: Witness immediate updates to Guizhou Chanhen's valuation as you change inputs.
- Preloaded Data: Comes equipped with Guizhou Chanhen's current financial information for swift assessment.
- Relied Upon by Experts: A go-to tool for investors and analysts making strategic decisions.
Who Should Utilize This Product?
- Investors: Effectively assess Guizhou Chanhen Chemical Corporation’s (002895SZ) fair value prior to making investment choices.
- CFOs: Utilize a professional-grade DCF model for comprehensive financial reporting and analysis.
- Consultants: Easily customize the template for valuation reports tailored to clients.
- Entrepreneurs: Acquire insights into the financial modeling practices of industry leaders.
- Educators: Employ it as an instructional resource to illustrate valuation techniques.
Contents of the Template
- Historical Data: Contains Guizhou Chanhen Chemical Corporation’s past financial performance and baseline forecasts.
- DCF and Levered DCF Models: Comprehensive templates for calculating the intrinsic value of Guizhou Chanhen Chemical Corporation (002895SZ).
- WACC Sheet: Pre-calculated metrics for the Weighted Average Cost of Capital.
- Editable Inputs: Adjust essential factors such as growth rates, EBITDA percentages, and CAPEX assumptions.
- Quarterly and Annual Statements: A thorough overview of Guizhou Chanhen Chemical Corporation’s financial statements.
- Interactive Dashboard: Dynamically visualize valuation outcomes and future projections.
Disclaimer
All information, articles, and product details provided on this website are for general informational and educational purposes only. We do not claim any ownership over, nor do we intend to infringe upon, any trademarks, copyrights, logos, brand names, or other intellectual property mentioned or depicted on this site. Such intellectual property remains the property of its respective owners, and any references here are made solely for identification or informational purposes, without implying any affiliation, endorsement, or partnership.
We make no representations or warranties, express or implied, regarding the accuracy, completeness, or suitability of any content or products presented. Nothing on this website should be construed as legal, tax, investment, financial, medical, or other professional advice. In addition, no part of this site—including articles or product references—constitutes a solicitation, recommendation, endorsement, advertisement, or offer to buy or sell any securities, franchises, or other financial instruments, particularly in jurisdictions where such activity would be unlawful.
All content is of a general nature and may not address the specific circumstances of any individual or entity. It is not a substitute for professional advice or services. Any actions you take based on the information provided here are strictly at your own risk. You accept full responsibility for any decisions or outcomes arising from your use of this website and agree to release us from any liability in connection with your use of, or reliance upon, the content or products found herein.