
|
Bank of Suzhou Co., Ltd. (002966.SZ) Valation DCF |
Entièrement Modifiable: Adapté À Vos Besoins Dans Excel Ou Sheets
Conception Professionnelle: Modèles Fiables Et Conformes Aux Normes Du Secteur
Pré-Construits Pour Une Utilisation Rapide Et Efficace
Compatible MAC/PC, entièrement débloqué
Aucune Expertise N'Est Requise; Facile À Suivre
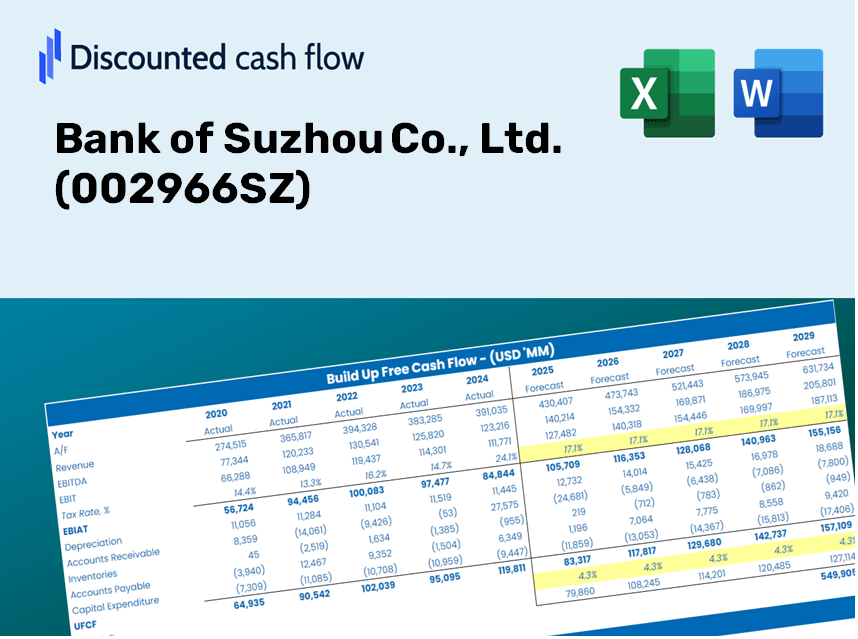
Bank of Suzhou Co., Ltd. (002966.SZ) Bundle
Évaluez les perspectives financières de Bank of Suzhou Co., Ltd. Comme un expert! Ce calculatrice DCF (002966SZ) fournit des données financières pré-remplies et une pleine flexibilité pour modifier la croissance des revenus, le WACC, les marges et d'autres hypothèses critiques pour s'aligner sur vos projections.
Discounted Cash Flow (DCF) - (USD MM)
| Year | AY1 2020 |
AY2 2021 |
AY3 2022 |
AY4 2023 |
AY5 2024 |
FY1 2025 |
FY2 2026 |
FY3 2027 |
FY4 2028 |
FY5 2029 |
|---|---|---|---|---|---|---|---|---|---|---|
| Revenue | 6,430.1 | 7,390.7 | 8,835.7 | 10,038.8 | 25,053.0 | 34,329.3 | 47,040.4 | 64,457.9 | 88,324.6 | 121,028.3 |
| Revenue Growth, % | 0 | 14.94 | 19.55 | 13.62 | 149.56 | 37.03 | 37.03 | 37.03 | 37.03 | 37.03 |
| EBITDA | 3,586.9 | 4,290.2 | 42.8 | 38.8 | .0 | 7,875.3 | 10,791.3 | 14,786.9 | 20,262.0 | 27,764.4 |
| EBITDA, % | 55.78 | 58.05 | 0.48423 | 0.38683 | 0 | 22.94 | 22.94 | 22.94 | 22.94 | 22.94 |
| Depreciation | 336.2 | 452.2 | 502.9 | 530.4 | 520.6 | 1,675.3 | 2,295.5 | 3,145.5 | 4,310.2 | 5,906.1 |
| Depreciation, % | 5.23 | 6.12 | 5.69 | 5.28 | 2.08 | 4.88 | 4.88 | 4.88 | 4.88 | 4.88 |
| EBIT | 3,250.7 | 3,838.0 | -460.2 | -491.6 | -520.6 | 6,200.0 | 8,495.7 | 11,641.4 | 15,951.8 | 21,858.3 |
| EBIT, % | 50.55 | 51.93 | -5.21 | -4.9 | -2.08 | 18.06 | 18.06 | 18.06 | 18.06 | 18.06 |
| Total Cash | 34,954.3 | 47,360.4 | 59,138.3 | 3,828.9 | 71,877.3 | 30,082.2 | 41,220.6 | 56,483.3 | 77,397.3 | 106,055.0 |
| Total Cash, percent | .0 | .0 | .0 | .0 | .0 | .0 | .0 | .0 | .0 | .0 |
| Account Receivables | 19,548.1 | 24,289.5 | 28,881.5 | 31,051.8 | 35,057.9 | 34,329.3 | 47,040.4 | 64,457.9 | 88,324.6 | 121,028.3 |
| Account Receivables, % | 304.01 | 328.65 | 326.87 | 309.32 | 139.93 | 100 | 100 | 100 | 100 | 100 |
| Inventories | .0 | -95,753.9 | -125,150.4 | .0 | .0 | -13,731.7 | -18,816.1 | -25,783.2 | -35,329.8 | -48,411.3 |
| Inventories, % | 0 | -1295.6 | -1416.42 | 0 | 0 | -40 | -40 | -40 | -40 | -40 |
| Accounts Payable | .0 | .0 | .0 | .0 | .0 | .0 | .0 | .0 | .0 | .0 |
| Accounts Payable, % | 0 | 0 | 0 | 0 | 0 | 0 | 0 | 0 | 0 | 0 |
| Capital Expenditure | -318.5 | -522.6 | -419.2 | -420.9 | -515.3 | -1,580.4 | -2,165.6 | -2,967.5 | -4,066.3 | -5,571.9 |
| Capital Expenditure, % | -4.95 | -7.07 | -4.74 | -4.19 | -2.06 | -4.6 | -4.6 | -4.6 | -4.6 | -4.6 |
| Tax Rate, % | 20.51 | 20.51 | 20.51 | 20.51 | 20.51 | 20.51 | 20.51 | 20.51 | 20.51 | 20.51 |
| EBITAT | 2,527.7 | 3,061.5 | -367.1 | -394.1 | -413.8 | 4,922.5 | 6,745.2 | 9,242.7 | 12,665.0 | 17,354.4 |
| Depreciation | ||||||||||
| Changes in Account Receivables | ||||||||||
| Changes in Inventories | ||||||||||
| Changes in Accounts Payable | ||||||||||
| Capital Expenditure | ||||||||||
| UFCF | -17,002.7 | 94,003.5 | 24,521.1 | -127,605.3 | -4,414.7 | 19,477.7 | -751.5 | -1,029.8 | -1,411.1 | -1,933.5 |
| WACC, % | 4.89 | 5 | 5 | 5.02 | 4.99 | 4.98 | 4.98 | 4.98 | 4.98 | 4.98 |
| PV UFCF | ||||||||||
| SUM PV UFCF | 14,303.5 | |||||||||
| Long Term Growth Rate, % | 2.00 | |||||||||
| Free cash flow (T + 1) | -1,972 | |||||||||
| Terminal Value | -66,165 | |||||||||
| Present Terminal Value | -51,890 | |||||||||
| Enterprise Value | -37,586 | |||||||||
| Net Debt | 75,701 | |||||||||
| Equity Value | -113,288 | |||||||||
| Diluted Shares Outstanding, MM | 4,446 | |||||||||
| Equity Value Per Share | -25.48 |
Benefits of Choosing Us
- Accurate 002966SZ Financial Data: Pre-loaded with Bank of Suzhou's historical and forecasted figures for thorough analysis.
- Customizable Template: Easily adjust key metrics such as revenue growth, WACC, and EBITDA %.
- Instant Calculations: Watch the intrinsic value of Bank of Suzhou update automatically with your input adjustments.
- Expert Valuation Tool: Tailored for investors, analysts, and consultants aiming for reliable DCF outcomes.
- Intuitive Interface: Clear layout and straightforward guidance suitable for users of all levels.
Key Features
- Comprehensive Data: Bank of Suzhou’s historical financial records and pre-populated forecasts.
- Customizable Inputs: Modify WACC, tax rates, revenue growth, and net interest margins.
- Real-Time Insights: Watch the intrinsic value of Bank of Suzhou (002966SZ) update instantly.
- Visual Performance Metrics: Dashboard graphs illustrate valuation outcomes and essential indicators.
- Designed for Precision: A robust tool crafted for analysts, investors, and financial professionals.
How It Works
- Step 1: Download the Excel file for Bank of Suzhou Co., Ltd. (002966SZ).
- Step 2: Review the pre-filled financial data for Bank of Suzhou (historical and projected).
- Step 3: Modify key assumptions (highlighted in yellow) based on your analysis.
- Step 4: Observe the automatic recalculations to determine Bank of Suzhou’s intrinsic value.
- Step 5: Utilize the results for making informed investment decisions or for reporting purposes.
Why Choose the Bank of Suzhou Co., Ltd. Calculator?
- Streamline Your Process: Skip the hassle of building a DCF model from the ground up – our tool is ready to go.
- Enhance Precision: Access reliable financial data and proven formulas to minimize valuation errors.
- Completely Customizable: Adjust the model to suit your unique assumptions and forecasts.
- User-Friendly Outputs: Clear visuals and results facilitate straightforward analysis.
- Preferred by Professionals: Crafted for experts who prioritize accuracy and ease of use.
Who Should Consider Using This Product?
- Investors: Assess the fair value of Bank of Suzhou Co., Ltd. (002966SZ) before making investment choices.
- CFOs: Utilize a professional-grade DCF model for financial reporting and analysis specific to Bank of Suzhou Co., Ltd. (002966SZ).
- Consultants: Efficiently customize the template for client valuation reports focused on Bank of Suzhou Co., Ltd. (002966SZ).
- Entrepreneurs: Discover financial modeling techniques employed by leading financial institutions like Bank of Suzhou Co., Ltd. (002966SZ).
- Educators: Incorporate it as a teaching resource to illustrate various valuation methodologies.
What the Template Includes
- Pre-Filled Data: Contains Bank of Suzhou Co., Ltd.'s historical financials and projections.
- Discounted Cash Flow Model: An adjustable DCF valuation model featuring automatic computations.
- Weighted Average Cost of Capital (WACC): A specific sheet for calculating WACC using tailored inputs.
- Key Financial Ratios: Evaluate Bank of Suzhou's profitability, efficiency, and leverage metrics.
- Customizable Inputs: Easily modify revenue growth, profit margins, and tax rates.
- Clear Dashboard: Visual charts and tables summarizing essential valuation outcomes.
Disclaimer
All information, articles, and product details provided on this website are for general informational and educational purposes only. We do not claim any ownership over, nor do we intend to infringe upon, any trademarks, copyrights, logos, brand names, or other intellectual property mentioned or depicted on this site. Such intellectual property remains the property of its respective owners, and any references here are made solely for identification or informational purposes, without implying any affiliation, endorsement, or partnership.
We make no representations or warranties, express or implied, regarding the accuracy, completeness, or suitability of any content or products presented. Nothing on this website should be construed as legal, tax, investment, financial, medical, or other professional advice. In addition, no part of this site—including articles or product references—constitutes a solicitation, recommendation, endorsement, advertisement, or offer to buy or sell any securities, franchises, or other financial instruments, particularly in jurisdictions where such activity would be unlawful.
All content is of a general nature and may not address the specific circumstances of any individual or entity. It is not a substitute for professional advice or services. Any actions you take based on the information provided here are strictly at your own risk. You accept full responsibility for any decisions or outcomes arising from your use of this website and agree to release us from any liability in connection with your use of, or reliance upon, the content or products found herein.