
|
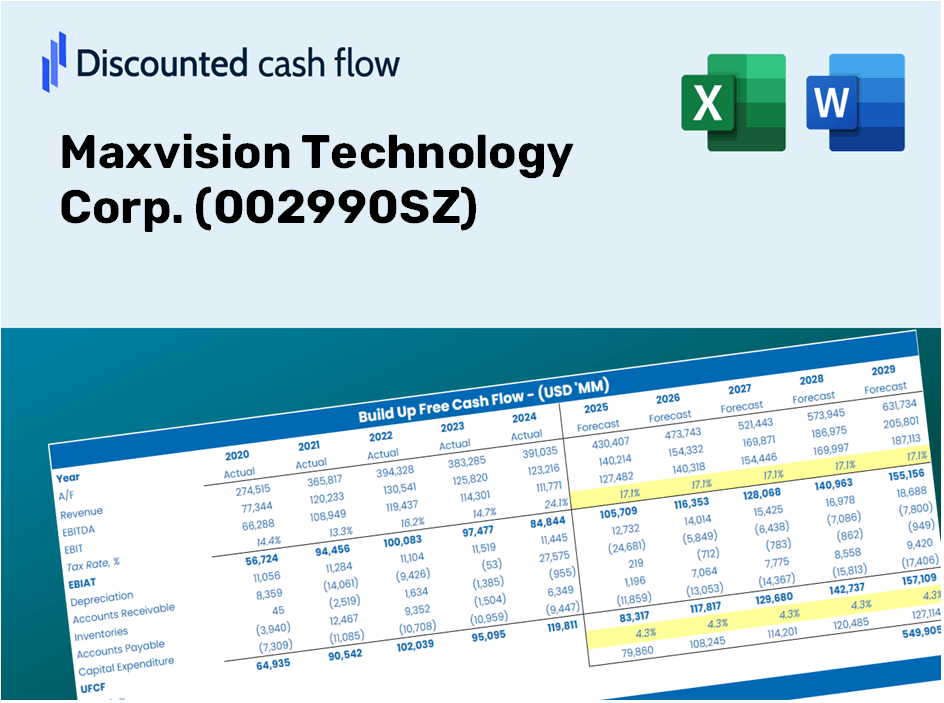
MaxVision Technology Corp. (002990.SZ) Évaluation DCF |
Entièrement Modifiable: Adapté À Vos Besoins Dans Excel Ou Sheets
Conception Professionnelle: Modèles Fiables Et Conformes Aux Normes Du Secteur
Pré-Construits Pour Une Utilisation Rapide Et Efficace
Compatible MAC/PC, entièrement débloqué
Aucune Expertise N'Est Requise; Facile À Suivre
Maxvision Technology Corp. (002990.SZ) Bundle
Découvrez la vraie valeur de MaxVision Technology Corp. (002990SZ) avec notre calculatrice avancée DCF! Ajustez les hypothèses clés, explorez divers scénarios et examinez comment les modifications affectent l'évaluation de Maxvision Technology Corp. (002990SZ) - toutes commodément dans un seul modèle Excel.
Discounted Cash Flow (DCF) - (USD MM)
| Year | AY1 2020 |
AY2 2021 |
AY3 2022 |
AY4 2023 |
AY5 2024 |
FY1 2025 |
FY2 2026 |
FY3 2027 |
FY4 2028 |
FY5 2029 |
|---|---|---|---|---|---|---|---|---|---|---|
| Revenue | 935.1 | 1,126.8 | 989.2 | 1,573.0 | 1,222.1 | 1,359.6 | 1,512.6 | 1,682.8 | 1,872.1 | 2,082.7 |
| Revenue Growth, % | 0 | 20.5 | -12.22 | 59.03 | -22.31 | 11.25 | 11.25 | 11.25 | 11.25 | 11.25 |
| EBITDA | 232.9 | 138.1 | 55.2 | 189.1 | 146.5 | 181.6 | 202.0 | 224.7 | 250.0 | 278.1 |
| EBITDA, % | 24.91 | 12.26 | 5.58 | 12.02 | 11.99 | 13.35 | 13.35 | 13.35 | 13.35 | 13.35 |
| Depreciation | 4.3 | 6.7 | 6.2 | 12.1 | 10.8 | 9.0 | 10.1 | 11.2 | 12.5 | 13.9 |
| Depreciation, % | 0.45472 | 0.59293 | 0.62834 | 0.76853 | 0.88108 | 0.66512 | 0.66512 | 0.66512 | 0.66512 | 0.66512 |
| EBIT | 228.7 | 131.5 | 49.0 | 177.0 | 135.8 | 172.5 | 191.9 | 213.5 | 237.5 | 264.3 |
| EBIT, % | 24.46 | 11.67 | 4.95 | 11.26 | 11.11 | 12.69 | 12.69 | 12.69 | 12.69 | 12.69 |
| Total Cash | 1,574.2 | 1,729.6 | 1,398.5 | 1,221.0 | 1,198.7 | 1,293.6 | 1,439.1 | 1,601.0 | 1,781.1 | 1,981.5 |
| Total Cash, percent | .0 | .0 | .0 | .0 | .0 | .0 | .0 | .0 | .0 | .0 |
| Account Receivables | 554.7 | 744.9 | 966.8 | 1,350.9 | 1,357.4 | 1,112.3 | 1,237.4 | 1,376.6 | 1,531.5 | 1,703.8 |
| Account Receivables, % | 59.32 | 66.11 | 97.74 | 85.88 | 111.07 | 81.81 | 81.81 | 81.81 | 81.81 | 81.81 |
| Inventories | 210.5 | 301.5 | 289.6 | 349.4 | 236.5 | 326.6 | 363.3 | 404.2 | 449.7 | 500.3 |
| Inventories, % | 22.52 | 26.76 | 29.27 | 22.21 | 19.35 | 24.02 | 24.02 | 24.02 | 24.02 | 24.02 |
| Accounts Payable | 238.6 | 426.5 | 433.1 | 721.2 | 182.5 | 456.7 | 508.0 | 565.2 | 628.8 | 699.5 |
| Accounts Payable, % | 25.52 | 37.85 | 43.78 | 45.85 | 14.93 | 33.59 | 33.59 | 33.59 | 33.59 | 33.59 |
| Capital Expenditure | -11.9 | -10.9 | -42.9 | -213.1 | -24.2 | -60.1 | -66.9 | -74.4 | -82.8 | -92.1 |
| Capital Expenditure, % | -1.27 | -0.96791 | -4.33 | -13.55 | -1.98 | -4.42 | -4.42 | -4.42 | -4.42 | -4.42 |
| Tax Rate, % | -1.27 | -1.27 | -1.27 | -1.27 | -1.27 | -1.27 | -1.27 | -1.27 | -1.27 | -1.27 |
| EBITAT | 200.6 | 127.0 | 62.1 | 164.8 | 137.5 | 164.7 | 183.2 | 203.8 | 226.8 | 252.3 |
| Depreciation | ||||||||||
| Changes in Account Receivables | ||||||||||
| Changes in Inventories | ||||||||||
| Changes in Accounts Payable | ||||||||||
| Capital Expenditure | ||||||||||
| UFCF | -333.7 | 29.5 | -177.9 | -192.1 | -308.3 | 542.8 | 15.9 | 17.7 | 19.7 | 21.9 |
| WACC, % | 7.84 | 7.85 | 7.85 | 7.85 | 7.85 | 7.85 | 7.85 | 7.85 | 7.85 | 7.85 |
| PV UFCF | ||||||||||
| SUM PV UFCF | 560.6 | |||||||||
| Long Term Growth Rate, % | 2.00 | |||||||||
| Free cash flow (T + 1) | 22 | |||||||||
| Terminal Value | 382 | |||||||||
| Present Terminal Value | 262 | |||||||||
| Enterprise Value | 823 | |||||||||
| Net Debt | -1,185 | |||||||||
| Equity Value | 2,008 | |||||||||
| Diluted Shares Outstanding, MM | 253 | |||||||||
| Equity Value Per Share | 7.92 |
Benefits You'll Receive
- Genuine 002990SZ Financial Data: Access both historical and projected metrics for precise valuation.
- Customizable Parameters: Adjust WACC, tax rates, revenue growth, and capital expenses to fit your analysis.
- Automated Calculations: Dynamic computation of intrinsic value and NPV at your fingertips.
- Scenario Analysis: Explore various scenarios to assess the future outlook of Maxvision Technology Corp.
- User-Friendly Design: Designed for industry experts while remaining easy for newcomers to navigate.
Key Features of Maxvision Technology Corp. (002990SZ)
- Customizable Forecast Inputs: Adjust essential metrics such as revenue growth, EBITDA %, and capital investments.
- Instant DCF Valuation: Provides quick calculations of intrinsic value, NPV, and additional financial outputs.
- High-Precision Accuracy: Leverages Maxvision's financial data for dependable valuation results.
- Simplified Scenario Analysis: Effortlessly test various assumptions and evaluate different outcomes.
- Efficiency Booster: Avoid the hassle of constructing intricate valuation models from the ground up.
How It Functions
- 1. Access the Template: Download and open the Excel file containing Maxvision Technology Corp.'s (002990SZ) preloaded information.
- 2. Adjust Key Assumptions: Modify essential inputs such as growth rates, WACC, and capital expenditures.
- 3. View Results in Real Time: The DCF model automatically calculates intrinsic value and NPV based on your inputs.
- 4. Explore Different Scenarios: Evaluate various forecasts to assess multiple valuation outcomes.
- 5. Present with Assurance: Share professional valuation insights to support your business decisions.
Why Opt for This Calculator?
- Precise Data: Actual Maxvision Technology Corp. (002990SZ) financials deliver trustworthy valuation outputs.
- Flexible: Modify essential factors such as growth rates, WACC, and tax rates to align with your forecasts.
- Efficient: Ready-to-use calculations save you the effort of starting from zero.
- High-Quality Tool: Created for investors, analysts, and consultants working with Maxvision Technology Corp. (002990SZ).
- Easy to Use: User-friendly design and clear instructions ensure accessibility for all users.
Who Can Benefit from Maxvision Technology Corp. (002990SZ)?
- Investors: Empower your investment choices with a sophisticated valuation tool tailored for professionals.
- Financial Analysts: Enhance efficiency with a ready-to-use DCF model that can be easily customized.
- Consultants: Effortlessly modify the template for impactful client presentations or comprehensive reports.
- Tech Enthusiasts: Broaden your insights into valuation methodologies with practical, real-world applications.
- Educators and Students: Utilize this resource as a hands-on learning aid in finance and technology courses.
Contents of the Template
- Comprehensive DCF Model: An editable template featuring intricate valuation computations.
- Real-World Data: Maxvision Technology Corp. (002990SZ) historical and projected financials preloaded for thorough analysis.
- Customizable Parameters: Modify WACC, growth rates, and tax assumptions to explore various scenarios.
- Financial Statements: Complete annual and quarterly breakdowns providing deeper insights.
- Key Ratios: In-built analysis for assessing profitability, efficiency, and leverage.
- Dashboard with Visual Outputs: Graphs and tables that present clear, actionable results.
Disclaimer
All information, articles, and product details provided on this website are for general informational and educational purposes only. We do not claim any ownership over, nor do we intend to infringe upon, any trademarks, copyrights, logos, brand names, or other intellectual property mentioned or depicted on this site. Such intellectual property remains the property of its respective owners, and any references here are made solely for identification or informational purposes, without implying any affiliation, endorsement, or partnership.
We make no representations or warranties, express or implied, regarding the accuracy, completeness, or suitability of any content or products presented. Nothing on this website should be construed as legal, tax, investment, financial, medical, or other professional advice. In addition, no part of this site—including articles or product references—constitutes a solicitation, recommendation, endorsement, advertisement, or offer to buy or sell any securities, franchises, or other financial instruments, particularly in jurisdictions where such activity would be unlawful.
All content is of a general nature and may not address the specific circumstances of any individual or entity. It is not a substitute for professional advice or services. Any actions you take based on the information provided here are strictly at your own risk. You accept full responsibility for any decisions or outcomes arising from your use of this website and agree to release us from any liability in connection with your use of, or reliance upon, the content or products found herein.