
|
Hebei Sinopack Electronic Technology Co., Ltd. (003031.SZ) Évaluation DCF |
Entièrement Modifiable: Adapté À Vos Besoins Dans Excel Ou Sheets
Conception Professionnelle: Modèles Fiables Et Conformes Aux Normes Du Secteur
Pré-Construits Pour Une Utilisation Rapide Et Efficace
Compatible MAC/PC, entièrement débloqué
Aucune Expertise N'Est Requise; Facile À Suivre
Hebei Sinopack Electronic Technology Co.,Ltd. (003031.SZ) Bundle
Gardez un aperçu de Hebei Sinopack Electronic Technology Co., Ltd. (003031SZ) Analyse d'évaluation avec notre calculatrice DCF de pointe! Chargé de données réelles (003031SZ), ce modèle Excel vous permet d'ajuster les prévisions et les hypothèses pour déterminer avec précision la valeur intrinsèque de Hebei Sinopack Electronic Technology Co., Ltd.
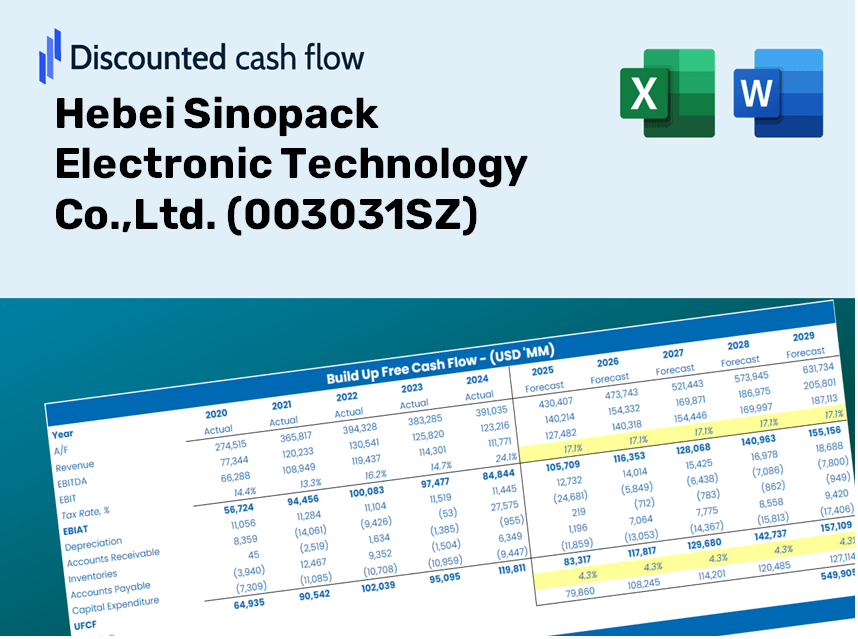
Discounted Cash Flow (DCF) - (USD MM)
| Year | AY1 2020 |
AY2 2021 |
AY3 2022 |
AY4 2023 |
AY5 2024 |
FY1 2025 |
FY2 2026 |
FY3 2027 |
FY4 2028 |
FY5 2029 |
|---|---|---|---|---|---|---|---|---|---|---|
| Revenue | 816.2 | 1,013.8 | 2,511.9 | 2,675.6 | 2,648.5 | 3,507.4 | 4,644.8 | 6,151.0 | 8,145.8 | 10,787.3 |
| Revenue Growth, % | 0 | 24.21 | 147.78 | 6.52 | -1.01 | 32.43 | 32.43 | 32.43 | 32.43 | 32.43 |
| EBITDA | 129.6 | 143.7 | 665.7 | 718.6 | 742.0 | 781.6 | 1,035.0 | 1,370.7 | 1,815.2 | 2,403.9 |
| EBITDA, % | 15.88 | 14.17 | 26.5 | 26.86 | 28.02 | 22.28 | 22.28 | 22.28 | 22.28 | 22.28 |
| Depreciation | 30.4 | 41.2 | 133.6 | 146.3 | 177.8 | 177.4 | 235.0 | 311.2 | 412.1 | 545.7 |
| Depreciation, % | 3.73 | 4.06 | 5.32 | 5.47 | 6.71 | 5.06 | 5.06 | 5.06 | 5.06 | 5.06 |
| EBIT | 99.1 | 102.5 | 532.0 | 572.2 | 564.2 | 604.1 | 800.1 | 1,059.5 | 1,403.1 | 1,858.1 |
| EBIT, % | 12.15 | 10.11 | 21.18 | 21.39 | 21.3 | 17.23 | 17.23 | 17.23 | 17.23 | 17.23 |
| Total Cash | 455.0 | 361.0 | 305.7 | 3,707.6 | 3,547.9 | 2,129.2 | 2,819.7 | 3,734.1 | 4,945.1 | 6,548.7 |
| Total Cash, percent | .0 | .0 | .0 | .0 | .0 | .0 | .0 | .0 | .0 | .0 |
| Account Receivables | 306.9 | 360.2 | .0 | 950.3 | 1,116.2 | 1,057.9 | 1,401.0 | 1,855.3 | 2,456.9 | 3,253.7 |
| Account Receivables, % | 37.61 | 35.54 | 0 | 35.52 | 42.15 | 30.16 | 30.16 | 30.16 | 30.16 | 30.16 |
| Inventories | 238.6 | 259.0 | 307.5 | 611.9 | 711.4 | 819.1 | 1,084.7 | 1,436.4 | 1,902.2 | 2,519.1 |
| Inventories, % | 29.24 | 25.55 | 12.24 | 22.87 | 26.86 | 23.35 | 23.35 | 23.35 | 23.35 | 23.35 |
| Accounts Payable | 283.2 | 266.0 | 677.4 | 892.1 | 484.5 | 978.9 | 1,296.3 | 1,716.7 | 2,273.4 | 3,010.6 |
| Accounts Payable, % | 34.7 | 26.24 | 26.97 | 33.34 | 18.3 | 27.91 | 27.91 | 27.91 | 27.91 | 27.91 |
| Capital Expenditure | -60.6 | -151.9 | -152.0 | -437.6 | -457.0 | -435.4 | -576.6 | -763.6 | -1,011.3 | -1,339.2 |
| Capital Expenditure, % | -7.43 | -14.98 | -6.05 | -16.36 | -17.25 | -12.41 | -12.41 | -12.41 | -12.41 | -12.41 |
| Tax Rate, % | 18.98 | 18.98 | 18.98 | 18.98 | 18.98 | 18.98 | 18.98 | 18.98 | 18.98 | 18.98 |
| EBITAT | 95.7 | 102.2 | 435.9 | 456.8 | 457.1 | 530.5 | 702.5 | 930.3 | 1,232.0 | 1,631.5 |
| Depreciation | ||||||||||
| Changes in Account Receivables | ||||||||||
| Changes in Inventories | ||||||||||
| Changes in Accounts Payable | ||||||||||
| Capital Expenditure | ||||||||||
| UFCF | -196.9 | -99.4 | 1,140.7 | -874.5 | -495.0 | 717.5 | 69.6 | 92.2 | 122.1 | 161.6 |
| WACC, % | 4.52 | 4.52 | 4.51 | 4.51 | 4.51 | 4.52 | 4.52 | 4.52 | 4.52 | 4.52 |
| PV UFCF | ||||||||||
| SUM PV UFCF | 1,062.8 | |||||||||
| Long Term Growth Rate, % | 4.00 | |||||||||
| Free cash flow (T + 1) | 168 | |||||||||
| Terminal Value | 32,526 | |||||||||
| Present Terminal Value | 26,080 | |||||||||
| Enterprise Value | 27,143 | |||||||||
| Net Debt | -2,506 | |||||||||
| Equity Value | 29,648 | |||||||||
| Diluted Shares Outstanding, MM | 449 | |||||||||
| Equity Value Per Share | 65.99 |
Benefits You Will Receive
- Pre-Filled Financial Model: Leverage Hebei Sinopack's actual data for accurate DCF valuation.
- Comprehensive Forecast Control: Modify revenue growth, profit margins, WACC, and other essential factors.
- Real-Time Calculations: Automatic updates allow you to see results instantly as you adjust inputs.
- Professional-Grade Template: A polished Excel file crafted for high-quality valuation presentations.
- Flexible and Reusable: Designed for adaptability, enabling multiple iterations for in-depth forecasts.
Key Features
- Comprehensive Financial Data: Pre-loaded with Hebei Sinopack Electronic Technology Co., Ltd.'s historical performance and future forecasts.
- Customizable Assumptions: Modify revenue projections, profit margins, discount rates, tax obligations, and capital expenditures to fit your analysis.
- Real-Time Valuation Model: Instantaneous updates to Net Present Value (NPV) and intrinsic value reflecting your customized inputs.
- Multiple Scenario Analysis: Generate various forecast models to evaluate differing valuation scenarios.
- Intuitive Interface: Designed for ease of use, suitable for both industry experts and newcomers.
How It Functions
- Download: Obtain the pre-configured Excel file containing financial data for Hebei Sinopack Electronic Technology Co., Ltd. (003031SZ).
- Customize: Tailor your forecasts by modifying parameters such as revenue growth, EBITDA %, and WACC.
- Auto-Update: The calculations for intrinsic value and NPV refresh automatically in real-time.
- Scenario Testing: Generate various projections and instantly compare different outcomes.
- Strategic Decision-Making: Leverage the valuation results to inform your investment approach.
Why Choose Hebei Sinopack Electronic Technology Co., Ltd. (003031SZ) Calculator?
- User-Friendly Design: Tailored for both novice users and seasoned professionals.
- Customizable Inputs: Adjust parameters easily to suit your analysis needs.
- Real-Time Valuation Updates: Observe immediate changes to Hebei Sinopack's valuation as you modify inputs.
- Instant Access to Data: Preloaded with Hebei Sinopack's actual financial metrics for swift evaluations.
- Widely Recognized: Trusted by investors and analysts for insightful decision-making.
Who Can Benefit from Our Products?
- Electronics Students: Master the latest technologies and apply your knowledge to real-world scenarios.
- Researchers: Utilize our advanced tools for your academic projects or innovative studies.
- Investors: Validate your investment strategies and analyze the performance of Hebei Sinopack [003031SZ].
- Industry Analysts: Enhance your analysis with our customizable data models and reports.
- Entrepreneurs: Understand the competitive landscape by analyzing operations of public companies like Hebei Sinopack [003031SZ].
Contents of the Template
- Comprehensive DCF Model: Editable template featuring detailed valuation calculations specific to Hebei Sinopack Electronic Technology Co., Ltd. (003031SZ).
- Real-World Data: Historical and projected financials for Hebei Sinopack preloaded for in-depth analysis.
- Customizable Parameters: Modify WACC, growth rates, and tax assumptions to explore various scenarios.
- Financial Statements: Complete annual and quarterly breakdowns for enhanced insights into performance.
- Key Ratios: Integrated analysis focusing on profitability, efficiency, and leverage metrics.
- Dashboard with Visual Outputs: Visualizations and tables that present clear, actionable results.
Disclaimer
All information, articles, and product details provided on this website are for general informational and educational purposes only. We do not claim any ownership over, nor do we intend to infringe upon, any trademarks, copyrights, logos, brand names, or other intellectual property mentioned or depicted on this site. Such intellectual property remains the property of its respective owners, and any references here are made solely for identification or informational purposes, without implying any affiliation, endorsement, or partnership.
We make no representations or warranties, express or implied, regarding the accuracy, completeness, or suitability of any content or products presented. Nothing on this website should be construed as legal, tax, investment, financial, medical, or other professional advice. In addition, no part of this site—including articles or product references—constitutes a solicitation, recommendation, endorsement, advertisement, or offer to buy or sell any securities, franchises, or other financial instruments, particularly in jurisdictions where such activity would be unlawful.
All content is of a general nature and may not address the specific circumstances of any individual or entity. It is not a substitute for professional advice or services. Any actions you take based on the information provided here are strictly at your own risk. You accept full responsibility for any decisions or outcomes arising from your use of this website and agree to release us from any liability in connection with your use of, or reliance upon, the content or products found herein.