
|
Poly Property Group Co., Limited (0119.hk) Valeure DCF |
Entièrement Modifiable: Adapté À Vos Besoins Dans Excel Ou Sheets
Conception Professionnelle: Modèles Fiables Et Conformes Aux Normes Du Secteur
Pré-Construits Pour Une Utilisation Rapide Et Efficace
Compatible MAC/PC, entièrement débloqué
Aucune Expertise N'Est Requise; Facile À Suivre
Poly Property Group Co., Limited (0119.HK) Bundle
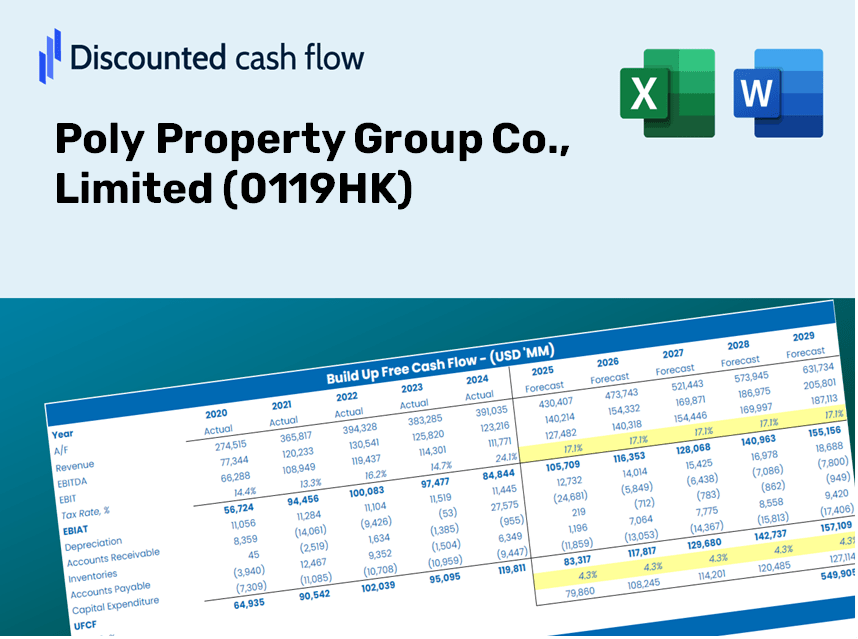
Explorez le potentiel financier de Poly Property Group Co., Limited (0119HK) avec notre calculatrice DCF conviviale! Entrez vos projections pour la croissance, les marges bénéficiaires et les dépenses pour calculer la valeur intrinsèque de Poly Property Group Co., Limited (0119HK) et améliorez votre stratégie d'investissement.
Discounted Cash Flow (DCF) - (USD MM)
| Year | AY1 2020 |
AY2 2021 |
AY3 2022 |
AY4 2023 |
AY5 2024 |
FY1 2025 |
FY2 2026 |
FY3 2027 |
FY4 2028 |
FY5 2029 |
|---|---|---|---|---|---|---|---|---|---|---|
| Revenue | 34,185.5 | 39,866.7 | 52,267.2 | 49,212.8 | 46,757.7 | 51,070.0 | 55,780.0 | 60,924.5 | 66,543.3 | 72,680.4 |
| Revenue Growth, % | 0 | 16.62 | 31.11 | -5.84 | -4.99 | 9.22 | 9.22 | 9.22 | 9.22 | 9.22 |
| EBITDA | 9,498.1 | 10,891.7 | 9,743.2 | 6,404.0 | 4,270.6 | 9,794.4 | 10,697.7 | 11,684.3 | 12,761.9 | 13,938.9 |
| EBITDA, % | 27.78 | 27.32 | 18.64 | 13.01 | 9.13 | 19.18 | 19.18 | 19.18 | 19.18 | 19.18 |
| Depreciation | 222.5 | 218.0 | 247.3 | 256.1 | 230.0 | 274.1 | 299.4 | 327.0 | 357.1 | 390.1 |
| Depreciation, % | 0.65096 | 0.54694 | 0.47323 | 0.52047 | 0.49196 | 0.53671 | 0.53671 | 0.53671 | 0.53671 | 0.53671 |
| EBIT | 9,275.6 | 10,673.6 | 9,495.8 | 6,147.8 | 4,040.6 | 9,520.3 | 10,398.3 | 11,357.3 | 12,404.8 | 13,548.8 |
| EBIT, % | 27.13 | 26.77 | 18.17 | 12.49 | 8.64 | 18.64 | 18.64 | 18.64 | 18.64 | 18.64 |
| Total Cash | 47,706.0 | 32,510.2 | 44,184.3 | 38,030.9 | 40,128.1 | 43,836.7 | 47,879.6 | 52,295.5 | 57,118.5 | 62,386.4 |
| Total Cash, percent | .0 | .0 | .0 | .0 | .0 | .0 | .0 | .0 | .0 | .0 |
| Account Receivables | 23,052.8 | 17,516.9 | 18,929.4 | 183.2 | 290.4 | 15,176.3 | 16,575.9 | 18,104.7 | 19,774.4 | 21,598.2 |
| Account Receivables, % | 67.43 | 43.94 | 36.22 | 0.37224 | 0.62116 | 29.72 | 29.72 | 29.72 | 29.72 | 29.72 |
| Inventories | 122,860.5 | 132,093.8 | 184,294.8 | 161,640.3 | 145,978.7 | 51,070.0 | 55,780.0 | 60,924.5 | 66,543.3 | 72,680.4 |
| Inventories, % | 359.39 | 331.34 | 352.6 | 328.45 | 312.2 | 100 | 100 | 100 | 100 | 100 |
| Accounts Payable | 13,705.2 | 16,823.4 | 22,041.3 | 20,694.7 | 18,097.8 | 20,960.8 | 22,894.0 | 25,005.5 | 27,311.6 | 29,830.5 |
| Accounts Payable, % | 40.09 | 42.2 | 42.17 | 42.05 | 38.71 | 41.04 | 41.04 | 41.04 | 41.04 | 41.04 |
| Capital Expenditure | -54.7 | -65.9 | -665.0 | -35.3 | -21.0 | -175.1 | -191.2 | -208.9 | -228.1 | -249.2 |
| Capital Expenditure, % | -0.15987 | -0.16527 | -1.27 | -0.07170641 | -0.04491766 | -0.34281 | -0.34281 | -0.34281 | -0.34281 | -0.34281 |
| Tax Rate, % | 86.05 | 86.05 | 86.05 | 86.05 | 86.05 | 86.05 | 86.05 | 86.05 | 86.05 | 86.05 |
| EBITAT | 2,164.9 | 2,720.4 | 1,328.1 | 2,877.9 | 563.6 | 2,352.9 | 2,569.9 | 2,806.9 | 3,065.8 | 3,348.5 |
| Depreciation | ||||||||||
| Changes in Account Receivables | ||||||||||
| Changes in Inventories | ||||||||||
| Changes in Accounts Payable | ||||||||||
| Capital Expenditure | ||||||||||
| UFCF | -129,875.4 | 2,293.5 | -47,485.2 | 43,152.9 | 13,730.1 | 85,337.9 | -1,498.5 | -1,636.7 | -1,787.7 | -1,952.5 |
| WACC, % | 1.34 | 1.42 | 1.02 | 2.15 | 1.02 | 1.39 | 1.39 | 1.39 | 1.39 | 1.39 |
| PV UFCF | ||||||||||
| SUM PV UFCF | 77,625.3 | |||||||||
| Long Term Growth Rate, % | 2.00 | |||||||||
| Free cash flow (T + 1) | -1,992 | |||||||||
| Terminal Value | 327,139 | |||||||||
| Present Terminal Value | 305,303 | |||||||||
| Enterprise Value | 382,928 | |||||||||
| Net Debt | 41,815 | |||||||||
| Equity Value | 341,113 | |||||||||
| Diluted Shares Outstanding, MM | 3,821 | |||||||||
| Equity Value Per Share | 89.27 |
What You Will Receive
- Customizable Excel Template: A fully adjustable Excel-based DCF Calculator featuring pre-populated financial data for Poly Property Group Co., Limited (0119HK).
- Relevant Data: Access to historical figures and projected estimates (highlighted in the yellow cells).
- Flexible Forecasting: Easily modify assumptions such as revenue growth, EBITDA %, and WACC.
- Instant Calculations: Quickly observe how your inputs influence the valuation of Poly Property Group Co., Limited (0119HK).
- Professional Resource: Designed for investors, CFOs, consultants, and financial analysts.
- Intuitive Design: Organized for straightforward navigation and ease of use, complete with step-by-step guidance.
Highlight Features
- Authentic Financial Data: Gain access to precise historical figures and future forecasts for Poly Property Group Co., Limited (0119HK).
- Tailorable Forecast Parameters: Modify the yellow-highlighted cells, including WACC, growth rates, and profit margins.
- Automated Calculations: Enjoy real-time updates for DCF, Net Present Value (NPV), and cash flow assessments.
- Visual Insights Dashboard: Clear charts and summaries to help you interpret your valuation outcomes effortlessly.
- Designed for All Skill Levels: A user-friendly layout ideal for investors, CFOs, and consultants alike.
How It Works
- Step 1: Download the Excel file.
- Step 2: Review the pre-filled data for Poly Property Group Co., Limited (0119HK) (historical and projected).
- Step 3: Modify key assumptions (yellow cells) according to your analysis.
- Step 4: Observe automatic recalculations for Poly Property Group Co., Limited's intrinsic value.
- Step 5: Utilize the results for making investment decisions or for reporting purposes.
Why Select This Calculator for Poly Property Group Co., Limited (0119HK)?
- All-in-One Resource: Features DCF, WACC, and financial ratio assessments all in one convenient tool.
- Adjustable Parameters: Modify the yellow-highlighted fields to explore different scenarios.
- In-Depth Analysis: Automatically computes Poly Property Group’s intrinsic value and Net Present Value.
- Preloaded Information: Historical and projected data provide reliable starting points for analysis.
- High-Caliber Quality: Perfectly suited for financial analysts, investors, and business consultants.
Who Can Benefit from This Product?
- Investors: Assess the valuation of Poly Property Group Co., Limited (0119HK) before making stock trades.
- CFOs and Financial Analysts: Optimize valuation procedures and verify projections.
- Startup Founders: Discover how leading public companies like Poly Property Group Co., Limited (0119HK) are evaluated.
- Consultants: Produce expert valuation reports for your clients.
- Students and Educators: Utilize real-world data to practice and instruct in valuation methodologies.
Contents of the Template
- Pre-Filled DCF Model: Poly Property Group’s financial data preloaded for immediate analysis.
- WACC Calculator: Comprehensive calculations for Weighted Average Cost of Capital.
- Financial Ratios: Assess Poly Property Group’s profitability, leverage, and operational efficiency.
- Editable Inputs: Modify assumptions like growth, margins, and CAPEX to suit your scenarios.
- Financial Statements: Access annual and quarterly reports for in-depth analysis.
- Interactive Dashboard: Effortlessly visualize key valuation metrics and outcomes.
Disclaimer
All information, articles, and product details provided on this website are for general informational and educational purposes only. We do not claim any ownership over, nor do we intend to infringe upon, any trademarks, copyrights, logos, brand names, or other intellectual property mentioned or depicted on this site. Such intellectual property remains the property of its respective owners, and any references here are made solely for identification or informational purposes, without implying any affiliation, endorsement, or partnership.
We make no representations or warranties, express or implied, regarding the accuracy, completeness, or suitability of any content or products presented. Nothing on this website should be construed as legal, tax, investment, financial, medical, or other professional advice. In addition, no part of this site—including articles or product references—constitutes a solicitation, recommendation, endorsement, advertisement, or offer to buy or sell any securities, franchises, or other financial instruments, particularly in jurisdictions where such activity would be unlawful.
All content is of a general nature and may not address the specific circumstances of any individual or entity. It is not a substitute for professional advice or services. Any actions you take based on the information provided here are strictly at your own risk. You accept full responsibility for any decisions or outcomes arising from your use of this website and agree to release us from any liability in connection with your use of, or reliance upon, the content or products found herein.