
|
Kunlun Energy Company Limited (0135.HK) Valation DCF |
Entièrement Modifiable: Adapté À Vos Besoins Dans Excel Ou Sheets
Conception Professionnelle: Modèles Fiables Et Conformes Aux Normes Du Secteur
Pré-Construits Pour Une Utilisation Rapide Et Efficace
Compatible MAC/PC, entièrement débloqué
Aucune Expertise N'Est Requise; Facile À Suivre
Kunlun Energy Company Limited (0135.HK) Bundle
Gagnez du temps et améliorez la précision avec notre calculatrice DCF (0135HK)! En utilisant des données réelles de Kunlun Energy Company Limited et des hypothèses personnalisables, cet outil vous permet de prévoir, analyser et valoriser (0135HK) comme un investisseur chevronné.
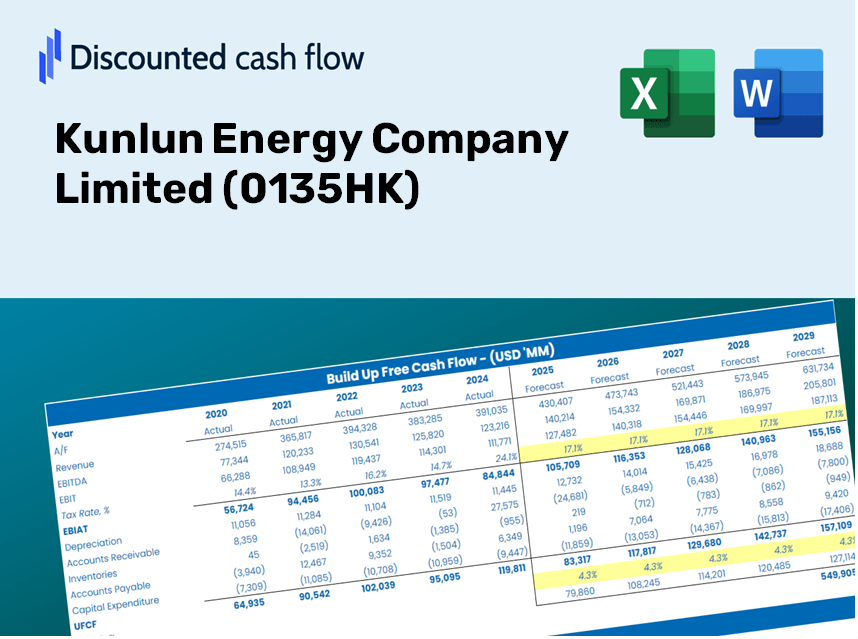
Discounted Cash Flow (DCF) - (USD MM)
| Year | AY1 2020 |
AY2 2021 |
AY3 2022 |
AY4 2023 |
AY5 2024 |
FY1 2025 |
FY2 2026 |
FY3 2027 |
FY4 2028 |
FY5 2029 |
|---|---|---|---|---|---|---|---|---|---|---|
| Revenue | 119,478.3 | 151,516.8 | 188,040.2 | 193,956.7 | 204,556.0 | 234,999.9 | 269,974.7 | 310,154.8 | 356,314.9 | 409,344.9 |
| Revenue Growth, % | 0 | 26.82 | 24.11 | 3.15 | 5.46 | 14.88 | 14.88 | 14.88 | 14.88 | 14.88 |
| EBITDA | 17,255.0 | 17,478.1 | 18,786.1 | 20,281.1 | 17,992.1 | 25,953.4 | 29,816.0 | 34,253.5 | 39,351.5 | 45,208.1 |
| EBITDA, % | 14.44 | 11.54 | 9.99 | 10.46 | 8.8 | 11.04 | 11.04 | 11.04 | 11.04 | 11.04 |
| Depreciation | 7,614.8 | 5,055.8 | 5,344.5 | 5,459.3 | 4,892.8 | 8,346.7 | 9,589.0 | 11,016.1 | 12,655.6 | 14,539.1 |
| Depreciation, % | 6.37 | 3.34 | 2.84 | 2.81 | 2.39 | 3.55 | 3.55 | 3.55 | 3.55 | 3.55 |
| EBIT | 9,640.2 | 12,422.4 | 13,441.6 | 14,821.7 | 13,099.3 | 17,606.7 | 20,227.1 | 23,237.4 | 26,695.9 | 30,669.0 |
| EBIT, % | 8.07 | 8.2 | 7.15 | 7.64 | 6.4 | 7.49 | 7.49 | 7.49 | 7.49 | 7.49 |
| Total Cash | 17,796.4 | 31,161.4 | 43,176.9 | 49,855.6 | 49,313.2 | 50,870.4 | 58,441.4 | 67,139.1 | 77,131.4 | 88,610.8 |
| Total Cash, percent | .0 | .0 | .0 | .0 | .0 | .0 | .0 | .0 | .0 | .0 |
| Account Receivables | 8,027.1 | 3,164.9 | 5,947.1 | 3,485.3 | 5,802.7 | 7,803.7 | 8,965.1 | 10,299.4 | 11,832.3 | 13,593.2 |
| Account Receivables, % | 6.72 | 2.09 | 3.16 | 1.8 | 2.84 | 3.32 | 3.32 | 3.32 | 3.32 | 3.32 |
| Inventories | 1,011.6 | 1,345.1 | 1,182.2 | 1,263.1 | 1,236.9 | 1,701.0 | 1,954.1 | 2,244.9 | 2,579.0 | 2,962.9 |
| Inventories, % | 0.84667 | 0.88779 | 0.62869 | 0.65124 | 0.60466 | 0.72381 | 0.72381 | 0.72381 | 0.72381 | 0.72381 |
| Accounts Payable | 3,669.1 | 3,505.0 | 3,403.3 | 3,052.3 | 3,396.8 | 4,901.3 | 5,630.8 | 6,468.8 | 7,431.5 | 8,537.6 |
| Accounts Payable, % | 3.07 | 2.31 | 1.81 | 1.57 | 1.66 | 2.09 | 2.09 | 2.09 | 2.09 | 2.09 |
| Capital Expenditure | -7,438.8 | -8,600.2 | -6,254.4 | -5,663.8 | -6,666.7 | -10,061.5 | -11,558.9 | -13,279.2 | -15,255.6 | -17,526.0 |
| Capital Expenditure, % | -6.23 | -5.68 | -3.33 | -2.92 | -3.26 | -4.28 | -4.28 | -4.28 | -4.28 | -4.28 |
| Tax Rate, % | 52.83 | 52.83 | 52.83 | 52.83 | 52.83 | 52.83 | 52.83 | 52.83 | 52.83 | 52.83 |
| EBITAT | 7,209.6 | 27,034.1 | 6,168.6 | 6,687.6 | 6,179.0 | 11,020.7 | 12,660.9 | 14,545.2 | 16,710.0 | 19,196.9 |
| Depreciation | ||||||||||
| Changes in Account Receivables | ||||||||||
| Changes in Inventories | ||||||||||
| Changes in Accounts Payable | ||||||||||
| Capital Expenditure | ||||||||||
| UFCF | 2,016.1 | 27,854.3 | 2,537.8 | 8,512.9 | 2,458.5 | 8,345.5 | 10,005.9 | 11,495.0 | 13,205.8 | 15,171.2 |
| WACC, % | 5 | 5.27 | 4.69 | 4.68 | 4.7 | 4.87 | 4.87 | 4.87 | 4.87 | 4.87 |
| PV UFCF | ||||||||||
| SUM PV UFCF | 49,906.4 | |||||||||
| Long Term Growth Rate, % | 2.00 | |||||||||
| Free cash flow (T + 1) | 15,475 | |||||||||
| Terminal Value | 539,711 | |||||||||
| Present Terminal Value | 425,562 | |||||||||
| Enterprise Value | 475,468 | |||||||||
| Net Debt | -3,880 | |||||||||
| Equity Value | 479,348 | |||||||||
| Diluted Shares Outstanding, MM | 8,659 | |||||||||
| Equity Value Per Share | 55.36 |
Benefits of Choosing Us
- Adjustable Forecast Parameters: Effortlessly modify assumptions (growth %, margins, WACC) to explore various scenarios.
- Comprehensive Data: Kunlun Energy's financial figures pre-loaded to facilitate your analysis.
- Automated DCF Calculations: The template computes Net Present Value (NPV) and intrinsic value automatically.
- Tailored and Professional Design: A refined Excel model that caters to your valuation requirements.
- Designed for Analysts and Investors: Perfect for assessing projections, validating strategies, and enhancing efficiency.
Key Features
- Customizable Forecast Inputs: Adjust essential parameters such as revenue growth, EBITDA margin, and capital expenditures specific to Kunlun Energy Company Limited (0135HK).
- Instant DCF Valuation: Quickly computes intrinsic value, NPV, and other key metrics for informed decision-making.
- High Precision Valuation: Leverages Kunlun Energy’s actual financial data to provide accurate valuation results.
- Simplified Scenario Analysis: Effortlessly evaluate various assumptions and analyze different outcomes.
- Efficiency Booster: Streamlines the valuation process, removing the need to construct intricate models from the ground up.
How It Functions
- Download the Template: Gain immediate access to the Excel-based KUNLUN (0135HK) DCF Calculator.
- Input Your Assumptions: Modify the yellow-highlighted cells for growth rates, WACC, margins, and additional parameters.
- Instant Calculations: The model automatically recalculates KUNLUN’s intrinsic value.
- Test Scenarios: Experiment with various assumptions to assess potential valuation fluctuations.
- Analyze and Decide: Leverage the results to inform your investment or financial analysis.
Why Choose This Calculator for Kunlun Energy Company Limited (0135HK)?
- Reliable Data: Utilize authentic financials of Kunlun Energy for accurate valuation outcomes.
- Tailored Options: Modify essential variables such as growth rates, WACC, and tax rates to align with your forecasts.
- Efficient: Ready-made calculations remove the hassle of starting from square one.
- Professional-Quality Tool: Crafted for investors, analysts, and financial consultants.
- Easy to Use: User-friendly design and detailed instructions simplify the process for everyone.
Who Can Benefit from This Product?
- Institutional Investors: Create thorough and reliable valuation models for analyzing investments in Kunlun Energy Company Limited (0135HK).
- Corporate Finance Departments: Evaluate valuation scenarios to inform strategies within the organization.
- Consultants and Financial Advisors: Equip clients with precise valuation insights specific to Kunlun Energy Company Limited (0135HK).
- Students and Instructors: Leverage real-world data to enhance skills in financial modeling and education.
- Energy Sector Enthusiasts: Gain insights into how companies like Kunlun Energy Company Limited (0135HK) are valued within the market.
Contents of the Template
- Detailed DCF Model: Customizable template with in-depth valuation metrics.
- Market Data: Kunlun Energy Company Limited's (0135HK) historical and forecasted financial information included for evaluation.
- Adjustable Variables: Modify WACC, growth assumptions, and tax rates to explore different scenarios.
- Financial Reports: Complete annual and quarterly financial statements for comprehensive analysis.
- Essential Ratios: Integrated analysis for measuring profitability, efficiency, and leverage.
- Interactive Dashboard: Graphs and tables showcasing clear and actionable insights.
Disclaimer
All information, articles, and product details provided on this website are for general informational and educational purposes only. We do not claim any ownership over, nor do we intend to infringe upon, any trademarks, copyrights, logos, brand names, or other intellectual property mentioned or depicted on this site. Such intellectual property remains the property of its respective owners, and any references here are made solely for identification or informational purposes, without implying any affiliation, endorsement, or partnership.
We make no representations or warranties, express or implied, regarding the accuracy, completeness, or suitability of any content or products presented. Nothing on this website should be construed as legal, tax, investment, financial, medical, or other professional advice. In addition, no part of this site—including articles or product references—constitutes a solicitation, recommendation, endorsement, advertisement, or offer to buy or sell any securities, franchises, or other financial instruments, particularly in jurisdictions where such activity would be unlawful.
All content is of a general nature and may not address the specific circumstances of any individual or entity. It is not a substitute for professional advice or services. Any actions you take based on the information provided here are strictly at your own risk. You accept full responsibility for any decisions or outcomes arising from your use of this website and agree to release us from any liability in connection with your use of, or reliance upon, the content or products found herein.