
|
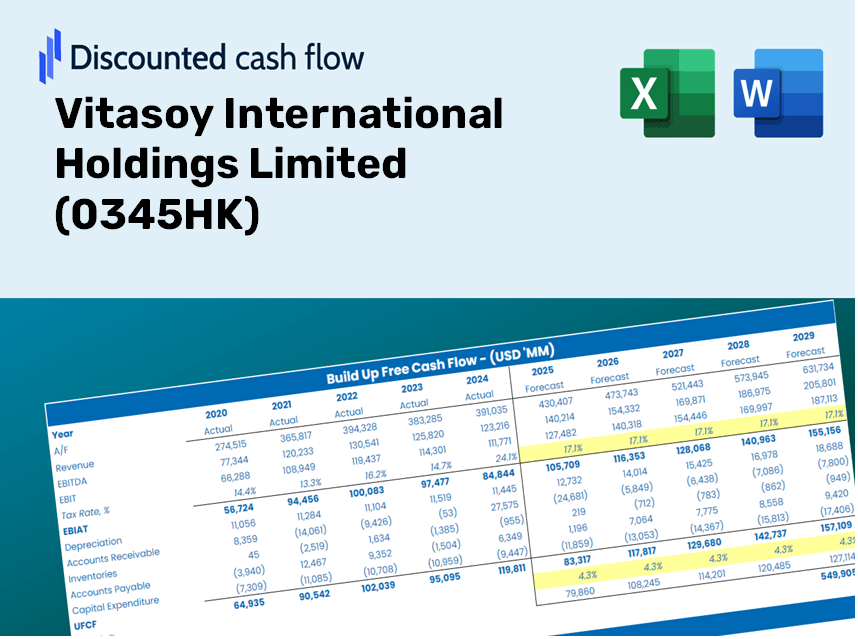
Vitasoy International Holdings Limited (0345.HK) Évaluation DCF |
Entièrement Modifiable: Adapté À Vos Besoins Dans Excel Ou Sheets
Conception Professionnelle: Modèles Fiables Et Conformes Aux Normes Du Secteur
Pré-Construits Pour Une Utilisation Rapide Et Efficace
Compatible MAC/PC, entièrement débloqué
Aucune Expertise N'Est Requise; Facile À Suivre
Vitasoy International Holdings Limited (0345.HK) Bundle
Optimisez votre temps et améliorez la précision avec notre calculatrice DCF (0345HK)! En utilisant des données réelles de Vitasoy International Holdings Limited et personnalisables, cet outil vous permet de prévoir, analyser et valoriser (0345HK) comme un investisseur chevronné.
What You Will Receive
- Real Vitasoy Financials: Access to both historical and projected data for precise valuation.
- Customizable Inputs: Adjust WACC, tax rates, revenue growth, and capital expenditures as needed.
- Automatic Calculations: Dynamic computation of intrinsic value and NPV.
- Scenario Analysis: Evaluate various scenarios to assess Vitasoy's future performance.
- User-Friendly Design: Designed for industry professionals, yet easy to navigate for beginners.
Key Features
- Real-Time Vitasoy Data: Pre-loaded with Vitasoy’s historical financial figures and future projections.
- Completely Customizable Inputs: Modify parameters such as revenue growth, profit margins, WACC, tax rates, and capital expenditures.
- Adaptive Valuation Model: Instantaneous updates to Net Present Value (NPV) and intrinsic value based on your adjustments.
- Scenario Analysis: Develop various forecasting scenarios to evaluate different valuation results.
- User-Friendly Interface: Intuitive, organized, and suitable for both professionals and novices.
How It Works
- Step 1: Download the prebuilt Excel template containing Vitasoy International's data.
- Step 2: Navigate through the pre-filled sheets to familiarize yourself with the essential metrics.
- Step 3: Adjust forecasts and assumptions in the editable yellow cells (WACC, growth, margins).
- Step 4: Immediately view the recalculated results, including Vitasoy's intrinsic value.
- Step 5: Make informed investment choices or create reports utilizing the results.
Why Opt for This Calculator?
- Precise Data: Authentic Vitasoy financials provide trustworthy valuation outcomes.
- Customizable: Tailor essential parameters such as growth rates, WACC, and tax rates to align with your forecasts.
- Time-Efficient: Ready-made calculations save you the hassle of starting from the ground up.
- Professional-Quality Tool: Crafted for investors, analysts, and industry consultants.
- User-Friendly: With its intuitive design and clear instructions, it's accessible for every user.
Who Can Benefit from This Product?
- Finance Students: Discover valuation techniques and practice them with real data.
- Academics: Integrate professional models into your research or teaching materials.
- Investors: Validate your assumptions and evaluate valuation results for Vitasoy International Holdings Limited (0345HK).
- Analysts: Enhance your efficiency with a ready-to-use, customizable DCF model.
- Small Business Owners: Understand the analytical approaches used for evaluating large public companies like Vitasoy International Holdings Limited (0345HK).
What the Template Includes
- Preloaded Vitasoy Data: Historical and projected financial figures, encompassing revenue, EBIT, and capital expenditures.
- DCF and WACC Models: Professional-grade templates for determining intrinsic value and Weighted Average Cost of Capital.
- Editable Inputs: Yellow-highlighted cells for modifying revenue growth, tax rates, and discount rates.
- Financial Statements: Detailed annual and quarterly financial reports for in-depth analysis.
- Key Ratios: Profitability, leverage, and efficiency ratios for performance evaluation.
- Dashboard and Charts: Visual representations of valuation results and underlying assumptions.
Disclaimer
All information, articles, and product details provided on this website are for general informational and educational purposes only. We do not claim any ownership over, nor do we intend to infringe upon, any trademarks, copyrights, logos, brand names, or other intellectual property mentioned or depicted on this site. Such intellectual property remains the property of its respective owners, and any references here are made solely for identification or informational purposes, without implying any affiliation, endorsement, or partnership.
We make no representations or warranties, express or implied, regarding the accuracy, completeness, or suitability of any content or products presented. Nothing on this website should be construed as legal, tax, investment, financial, medical, or other professional advice. In addition, no part of this site—including articles or product references—constitutes a solicitation, recommendation, endorsement, advertisement, or offer to buy or sell any securities, franchises, or other financial instruments, particularly in jurisdictions where such activity would be unlawful.
All content is of a general nature and may not address the specific circumstances of any individual or entity. It is not a substitute for professional advice or services. Any actions you take based on the information provided here are strictly at your own risk. You accept full responsibility for any decisions or outcomes arising from your use of this website and agree to release us from any liability in connection with your use of, or reliance upon, the content or products found herein.