
|
Pékin North Star Company Limited (0588.hk) Évaluation DCF |
Entièrement Modifiable: Adapté À Vos Besoins Dans Excel Ou Sheets
Conception Professionnelle: Modèles Fiables Et Conformes Aux Normes Du Secteur
Pré-Construits Pour Une Utilisation Rapide Et Efficace
Compatible MAC/PC, entièrement débloqué
Aucune Expertise N'Est Requise; Facile À Suivre
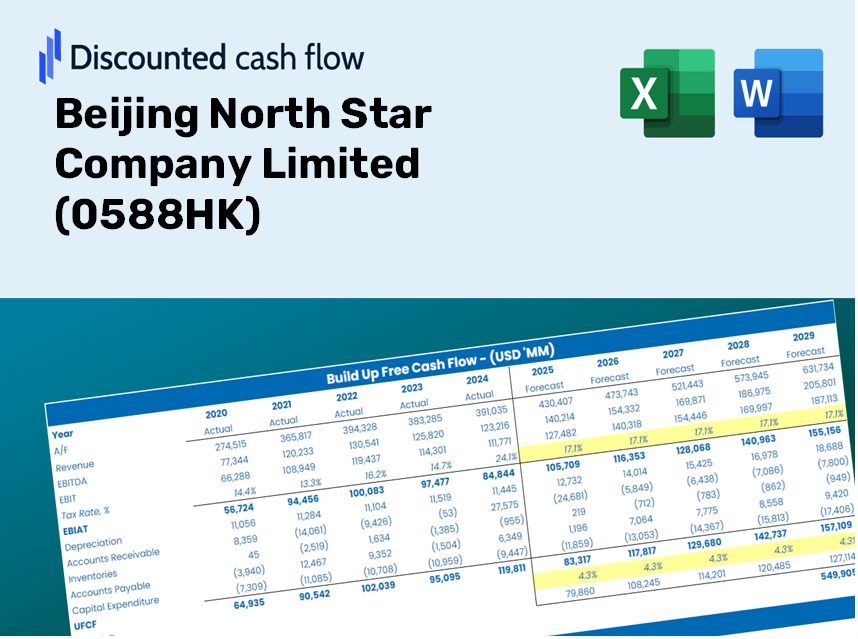
Beijing North Star Company Limited (0588.HK) Bundle
Conçu pour la précision, notre calculatrice DCF (0588HK) vous permet d'évaluer l'évaluation de Beijing North Star Company Limited en utilisant des données financières du monde réel tout en offrant une flexibilité complète pour modifier tous les paramètres essentiels pour des projections améliorées.
Benefits You Will Receive
- Authentic 0588HK Financial Data: Pre-loaded with Beijing North Star Company Limited’s historical and forecasted figures for accurate analysis.
- Completely Customizable Template: Effortlessly adjust essential inputs such as revenue growth, WACC, and EBITDA percentages.
- Instant Calculations: View the intrinsic value of 0588HK update in real-time as you modify inputs.
- Professional Valuation Tool: Tailored for investors, analysts, and consultants aiming for precise DCF outcomes.
- User-Friendly Interface: Intuitive layout and straightforward instructions accessible to all skill levels.
Key Features
- Pre-Loaded Data: Historical financial statements and pre-filled forecasts for Beijing North Star Company Limited (0588HK).
- Fully Adjustable Inputs: Customize WACC, tax rates, revenue growth, and EBITDA margins to suit your analysis.
- Instant Results: Observe the recalculation of Beijing North Star Company Limited's (0588HK) intrinsic value in real time.
- Clear Visual Outputs: Dashboard charts effectively showcase valuation results and key performance metrics.
- Built for Accuracy: A professional-grade tool designed for analysts, investors, and finance professionals.
How It Functions
- Step 1: Download the ready-to-use Excel template featuring Beijing North Star Company Limited’s data.
- Step 2: Navigate through the pre-filled sheets to grasp the essential metrics.
- Step 3: Adjust forecasts and assumptions in the editable yellow cells (WACC, growth, margins).
- Step 4: Instantly see the recalculated results, including the intrinsic value of Beijing North Star Company Limited (0588HK).
- Step 5: Use the outputs to make informed investment decisions or create reports.
Why Choose This Calculator for Beijing North Star Company Limited (0588HK)?
- User-Friendly Design: Tailored for both newcomers and seasoned users.
- Customizable Inputs: Easily adjust parameters to suit your specific analysis.
- Real-Time Adjustments: Instantly observe changes in Beijing North Star's valuation as you modify inputs.
- Preconfigured Data: Comes with Beijing North Star's actual financial metrics for efficient analysis.
- Preferred by Experts: A go-to tool for investors and analysts to aid in making strategic decisions.
Who Can Benefit from This Product?
- Professional Investors: Develop comprehensive and precise valuation models for portfolio assessment.
- Corporate Finance Teams: Evaluate valuation scenarios to inform strategic decisions within the organization.
- Consultants and Advisors: Deliver accurate valuation insights to clients regarding Beijing North Star Company Limited (0588HK).
- Students and Educators: Utilize real-world data to enhance practical skills and teach financial modeling concepts.
- Tech Enthusiasts: Gain a deeper understanding of market valuations for tech firms like Beijing North Star Company Limited (0588HK).
Contents of the Template
- Historical Data: Provides Beijing North Star Company Limited’s (0588HK) previous financials and foundational forecasts.
- DCF and Levered DCF Models: Comprehensive templates for assessing the intrinsic value of Beijing North Star Company Limited (0588HK).
- WACC Sheet: Pre-configured calculations for the Weighted Average Cost of Capital.
- Editable Inputs: Adjust essential drivers such as growth rates, EBITDA percentages, and CAPEX assumptions.
- Quarterly and Annual Statements: Thorough analysis of Beijing North Star Company Limited’s (0588HK) financials.
- Interactive Dashboard: Dynamically visualize valuation results and forecasts.
Disclaimer
All information, articles, and product details provided on this website are for general informational and educational purposes only. We do not claim any ownership over, nor do we intend to infringe upon, any trademarks, copyrights, logos, brand names, or other intellectual property mentioned or depicted on this site. Such intellectual property remains the property of its respective owners, and any references here are made solely for identification or informational purposes, without implying any affiliation, endorsement, or partnership.
We make no representations or warranties, express or implied, regarding the accuracy, completeness, or suitability of any content or products presented. Nothing on this website should be construed as legal, tax, investment, financial, medical, or other professional advice. In addition, no part of this site—including articles or product references—constitutes a solicitation, recommendation, endorsement, advertisement, or offer to buy or sell any securities, franchises, or other financial instruments, particularly in jurisdictions where such activity would be unlawful.
All content is of a general nature and may not address the specific circumstances of any individual or entity. It is not a substitute for professional advice or services. Any actions you take based on the information provided here are strictly at your own risk. You accept full responsibility for any decisions or outcomes arising from your use of this website and agree to release us from any liability in connection with your use of, or reliance upon, the content or products found herein.