
|
Shenzhen Investment Limited (0604.HK) Valation DCF |
Entièrement Modifiable: Adapté À Vos Besoins Dans Excel Ou Sheets
Conception Professionnelle: Modèles Fiables Et Conformes Aux Normes Du Secteur
Pré-Construits Pour Une Utilisation Rapide Et Efficace
Compatible MAC/PC, entièrement débloqué
Aucune Expertise N'Est Requise; Facile À Suivre
Shenzhen Investment Limited (0604.HK) Bundle
Rationalisez votre analyse financière et améliorez la précision avec notre calculatrice DCF (0604HK)! En utilisant des données réelles de Shenzhen Investment Limited et personnalisables, cet outil vous permet de prévoir, analyser et valoriser (0604HK) comme un investisseur chevronné.
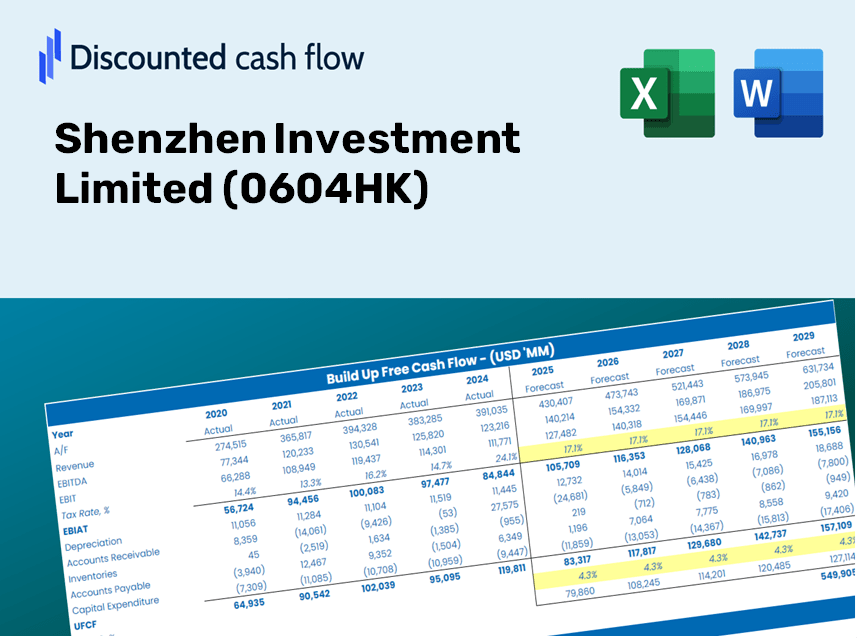
Discounted Cash Flow (DCF) - (USD MM)
| Year | AY1 2020 |
AY2 2021 |
AY3 2022 |
AY4 2023 |
AY5 2024 |
FY1 2025 |
FY2 2026 |
FY3 2027 |
FY4 2028 |
FY5 2029 |
|---|---|---|---|---|---|---|---|---|---|---|
| Revenue | 18,803.0 | 32,050.3 | 31,540.2 | 15,832.1 | 15,567.5 | 16,244.1 | 16,950.2 | 17,687.0 | 18,455.7 | 19,257.9 |
| Revenue Growth, % | 0 | 70.45 | -1.59 | -49.8 | -1.67 | 4.35 | 4.35 | 4.35 | 4.35 | 4.35 |
| EBITDA | 7,283.2 | 10,573.5 | 8,455.9 | 3,230.7 | 2,791.6 | 4,446.7 | 4,640.0 | 4,841.7 | 5,052.2 | 5,271.8 |
| EBITDA, % | 38.73 | 32.99 | 26.81 | 20.41 | 17.93 | 27.37 | 27.37 | 27.37 | 27.37 | 27.37 |
| Depreciation | 240.8 | 175.0 | 231.0 | 245.6 | 232.5 | 182.0 | 189.9 | 198.2 | 206.8 | 215.8 |
| Depreciation, % | 1.28 | 0.54602 | 0.73228 | 1.55 | 1.49 | 1.12 | 1.12 | 1.12 | 1.12 | 1.12 |
| EBIT | 7,042.5 | 10,398.5 | 8,224.9 | 2,985.1 | 2,559.1 | 4,264.7 | 4,450.1 | 4,643.5 | 4,845.3 | 5,055.9 |
| EBIT, % | 37.45 | 32.44 | 26.08 | 18.85 | 16.44 | 26.25 | 26.25 | 26.25 | 26.25 | 26.25 |
| Total Cash | 16,168.5 | 19,919.1 | 11,669.9 | 11,054.8 | 5,786.9 | 9,491.0 | 9,903.5 | 10,334.0 | 10,783.2 | 11,251.9 |
| Total Cash, percent | .0 | .0 | .0 | .0 | .0 | .0 | .0 | .0 | .0 | .0 |
| Account Receivables | 8,138.9 | 6,814.9 | 2,180.1 | 6,771.0 | 1,448.6 | 4,013.4 | 4,187.8 | 4,369.9 | 4,559.8 | 4,758.0 |
| Account Receivables, % | 43.29 | 21.26 | 6.91 | 42.77 | 9.31 | 24.71 | 24.71 | 24.71 | 24.71 | 24.71 |
| Inventories | 58,488.5 | 69,678.7 | 82,949.6 | 91,991.9 | 93,534.2 | 16,244.1 | 16,950.2 | 17,687.0 | 18,455.7 | 19,257.9 |
| Inventories, % | 311.06 | 217.4 | 263 | 581.05 | 600.83 | 100 | 100 | 100 | 100 | 100 |
| Accounts Payable | 3,863.1 | 4,408.2 | 6,335.1 | 6,048.0 | 5,803.3 | 4,219.0 | 4,402.4 | 4,593.8 | 4,793.5 | 5,001.8 |
| Accounts Payable, % | 20.54 | 13.75 | 20.09 | 38.2 | 37.28 | 25.97 | 25.97 | 25.97 | 25.97 | 25.97 |
| Capital Expenditure | -299.5 | -353.3 | -1,021.3 | -443.3 | -926.3 | -477.0 | -497.8 | -519.4 | -542.0 | -565.6 |
| Capital Expenditure, % | -1.59 | -1.1 | -3.24 | -2.8 | -5.95 | -2.94 | -2.94 | -2.94 | -2.94 | -2.94 |
| Tax Rate, % | -121.67 | -121.67 | -121.67 | -121.67 | -121.67 | -121.67 | -121.67 | -121.67 | -121.67 | -121.67 |
| EBITAT | 3,223.4 | -7,758.7 | 2,328.3 | -439.4 | 5,672.8 | 1,484.8 | 1,549.3 | 1,616.7 | 1,686.9 | 1,760.3 |
| Depreciation | ||||||||||
| Changes in Account Receivables | ||||||||||
| Changes in Inventories | ||||||||||
| Changes in Accounts Payable | ||||||||||
| Capital Expenditure | ||||||||||
| UFCF | -59,599.7 | -17,258.0 | -5,171.2 | -14,557.5 | 8,514.4 | 74,330.8 | 544.4 | 568.0 | 592.7 | 618.5 |
| WACC, % | 2.28 | 0.80852 | 1.72 | 0.80852 | 4.03 | 1.93 | 1.93 | 1.93 | 1.93 | 1.93 |
| PV UFCF | ||||||||||
| SUM PV UFCF | 75,095.1 | |||||||||
| Long Term Growth Rate, % | 2.00 | |||||||||
| Free cash flow (T + 1) | 631 | |||||||||
| Terminal Value | -897,435 | |||||||||
| Present Terminal Value | -815,641 | |||||||||
| Enterprise Value | -740,546 | |||||||||
| Net Debt | 59,334 | |||||||||
| Equity Value | -799,881 | |||||||||
| Diluted Shares Outstanding, MM | 8,899 | |||||||||
| Equity Value Per Share | -89.89 |
What You Will Receive
- Authentic 0604HK Financial Data: Pre-loaded with Shenzhen Investment Limited's historical and projected information for accurate analysis.
- Fully Customizable Template: Easily adjust essential inputs such as revenue growth, WACC, and EBITDA %.
- Instant Calculations: Witness the immediate update of Shenzhen’s intrinsic value as you make changes.
- Professional Valuation Tool: Tailored for investors, analysts, and consultants aiming for precise DCF outcomes.
- User-Friendly Interface: An intuitive layout and straightforward instructions suitable for all skill levels.
Key Features
- Advanced DCF Calculator: Offers comprehensive unlevered and levered DCF valuation models tailored for Shenzhen Investment Limited (0604HK).
- WACC Calculator: Features a pre-built Weighted Average Cost of Capital sheet with adjustable inputs for your convenience.
- Customizable Forecast Assumptions: Easily change growth rates, capital expenditures, and discount rates to fit your analysis.
- Integrated Financial Ratios: Evaluate profitability, leverage, and efficiency ratios specifically for Shenzhen Investment Limited (0604HK).
- Dashboard and Visual Charts: Summarize essential valuation metrics with visual outputs for straightforward analysis.
How It Functions
- Step 1: Download the ready-to-use Excel template featuring Shenzhen Investment Limited’s (0604HK) data.
- Step 2: Review the pre-populated sheets to familiarize yourself with the essential metrics.
- Step 3: Modify forecasts and assumptions in the editable yellow cells (WACC, growth rates, margins).
- Step 4: Quickly access updated results, including the intrinsic value of Shenzhen Investment Limited (0604HK).
- Step 5: Utilize the outputs to make well-informed investment choices or generate comprehensive reports.
Why Choose This Calculator for Shenzhen Investment Limited (0604HK)?
- Precision: Utilizes real Shenzhen Investment Limited financials for reliable data.
- Versatility: Built to allow users to experiment and adjust inputs effortlessly.
- Efficiency: Eliminate the need to create a DCF model from the ground up.
- Expert-Level: Crafted with the expertise and usability expected by finance leaders.
- Intuitive: Simple to navigate, even for those without extensive financial modeling skills.
Who Should Utilize Shenzhen Investment Limited (0604HK)?
- Investors: Accurately assess the fair value of Shenzhen Investment Limited (0604HK) before making investment choices.
- CFOs: Utilize a professional-grade DCF model for thorough financial reporting and analysis.
- Consultants: Swiftly customize the template for client valuation reports.
- Entrepreneurs: Discover valuable insights into financial modeling practices employed by leading companies.
- Educators: Implement it as a teaching resource to illustrate various valuation methodologies.
Contents of the Template
- Operating and Balance Sheet Data: Pre-filled historical data and forecasts for Shenzhen Investment Limited (0604HK), including revenue, EBITDA, EBIT, and capital expenditures.
- WACC Calculation: A dedicated sheet for Weighted Average Cost of Capital (WACC), featuring parameters such as Beta, risk-free rate, and share price.
- DCF Valuation (Unlevered and Levered): Customizable Discounted Cash Flow models that provide intrinsic value with comprehensive calculations.
- Financial Statements: Pre-loaded annual and quarterly financial statements to facilitate detailed analysis.
- Key Ratios: Contains profitability, leverage, and efficiency ratios for Shenzhen Investment Limited (0604HK).
- Dashboard and Charts: Visual representations of valuation outputs and assumptions for straightforward analysis of results.
Disclaimer
All information, articles, and product details provided on this website are for general informational and educational purposes only. We do not claim any ownership over, nor do we intend to infringe upon, any trademarks, copyrights, logos, brand names, or other intellectual property mentioned or depicted on this site. Such intellectual property remains the property of its respective owners, and any references here are made solely for identification or informational purposes, without implying any affiliation, endorsement, or partnership.
We make no representations or warranties, express or implied, regarding the accuracy, completeness, or suitability of any content or products presented. Nothing on this website should be construed as legal, tax, investment, financial, medical, or other professional advice. In addition, no part of this site—including articles or product references—constitutes a solicitation, recommendation, endorsement, advertisement, or offer to buy or sell any securities, franchises, or other financial instruments, particularly in jurisdictions where such activity would be unlawful.
All content is of a general nature and may not address the specific circumstances of any individual or entity. It is not a substitute for professional advice or services. Any actions you take based on the information provided here are strictly at your own risk. You accept full responsibility for any decisions or outcomes arising from your use of this website and agree to release us from any liability in connection with your use of, or reliance upon, the content or products found herein.