
|
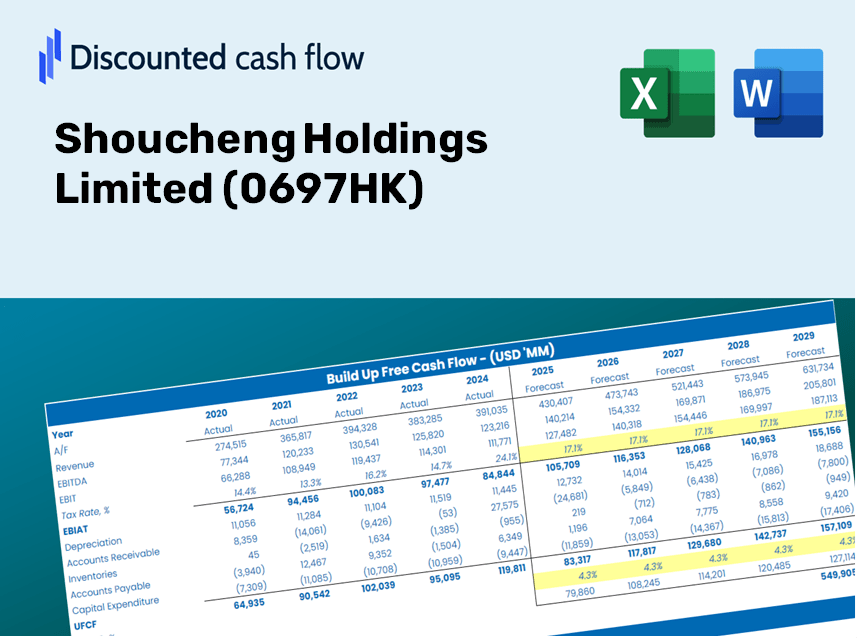
Shoucheng Holdings Limited (0697.hk) Évaluation DCF |
Entièrement Modifiable: Adapté À Vos Besoins Dans Excel Ou Sheets
Conception Professionnelle: Modèles Fiables Et Conformes Aux Normes Du Secteur
Pré-Construits Pour Une Utilisation Rapide Et Efficace
Compatible MAC/PC, entièrement débloqué
Aucune Expertise N'Est Requise; Facile À Suivre
Shoucheng Holdings Limited (0697.HK) Bundle
Conçu pour la précision, notre calculatrice DCF (0697HK) vous permet d'évaluer l'évaluation de Shoucheng Holdings Limited à l'aide de données financières réelles, offrant une flexibilité complète pour modifier tous les paramètres essentiels pour des projections améliorées.
Discounted Cash Flow (DCF) - (USD MM)
| Year | AY1 2020 |
AY2 2021 |
AY3 2022 |
AY4 2023 |
AY5 2024 |
FY1 2025 |
FY2 2026 |
FY3 2027 |
FY4 2028 |
FY5 2029 |
|---|---|---|---|---|---|---|---|---|---|---|
| Revenue | 705.9 | 1,195.0 | 1,599.8 | 883.5 | 1,215.1 | 1,506.6 | 1,867.9 | 2,315.9 | 2,871.4 | 3,560.0 |
| Revenue Growth, % | 0 | 69.3 | 33.87 | -44.78 | 37.54 | 23.98 | 23.98 | 23.98 | 23.98 | 23.98 |
| EBITDA | 235.5 | -817.4 | 1,552.1 | 806.0 | 846.9 | 671.6 | 832.7 | 1,032.5 | 1,280.1 | 1,587.1 |
| EBITDA, % | 33.37 | -68.4 | 97.02 | 91.23 | 69.69 | 44.58 | 44.58 | 44.58 | 44.58 | 44.58 |
| Depreciation | 173.7 | 228.8 | 206.0 | 171.0 | 256.5 | 292.5 | 362.7 | 449.7 | 557.6 | 691.3 |
| Depreciation, % | 24.61 | 19.15 | 12.88 | 19.35 | 21.11 | 19.42 | 19.42 | 19.42 | 19.42 | 19.42 |
| EBIT | 61.8 | -1,046.2 | 1,346.1 | 635.0 | 590.4 | 379.1 | 470.0 | 582.8 | 722.5 | 895.8 |
| EBIT, % | 8.76 | -87.55 | 84.14 | 71.88 | 48.59 | 25.16 | 25.16 | 25.16 | 25.16 | 25.16 |
| Total Cash | 4,253.3 | 4,196.7 | 5,219.9 | 5,187.6 | 5,771.9 | 1,506.6 | 1,867.9 | 2,315.9 | 2,871.4 | 3,560.0 |
| Total Cash, percent | .0 | .0 | .0 | .0 | .0 | .0 | .0 | .0 | .0 | .0 |
| Account Receivables | 444.0 | 250.0 | 567.6 | 203.6 | 420.4 | 533.2 | 661.1 | 819.7 | 1,016.2 | 1,260.0 |
| Account Receivables, % | 62.91 | 20.92 | 35.48 | 23.05 | 34.6 | 35.39 | 35.39 | 35.39 | 35.39 | 35.39 |
| Inventories | .0 | .0 | .0 | .0 | .0 | .0 | .0 | .0 | .0 | .0 |
| Inventories, % | 0 | 0 | 0 | 0 | 0 | 0 | 0 | 0 | 0 | 0 |
| Accounts Payable | 204.6 | 389.3 | 354.0 | 485.6 | 452.8 | 530.1 | 657.2 | 814.8 | 1,010.2 | 1,252.5 |
| Accounts Payable, % | 28.99 | 32.58 | 22.12 | 54.96 | 37.26 | 35.18 | 35.18 | 35.18 | 35.18 | 35.18 |
| Capital Expenditure | -97.7 | -2.2 | -36.3 | -104.3 | -75.9 | -103.5 | -128.3 | -159.1 | -197.2 | -244.5 |
| Capital Expenditure, % | -13.84 | -0.18033 | -2.27 | -11.8 | -6.25 | -6.87 | -6.87 | -6.87 | -6.87 | -6.87 |
| Tax Rate, % | 13.48 | 13.48 | 13.48 | 13.48 | 13.48 | 13.48 | 13.48 | 13.48 | 13.48 | 13.48 |
| EBITAT | 60.6 | -1,158.6 | 1,048.8 | 549.4 | 510.8 | 340.4 | 422.0 | 523.3 | 648.8 | 804.4 |
| Depreciation | ||||||||||
| Changes in Account Receivables | ||||||||||
| Changes in Inventories | ||||||||||
| Changes in Accounts Payable | ||||||||||
| Capital Expenditure | ||||||||||
| UFCF | -102.8 | -553.2 | 865.4 | 1,111.7 | 441.7 | 494.0 | 655.7 | 813.0 | 1,007.9 | 1,249.7 |
| WACC, % | 5.21 | 5.22 | 5.08 | 5.13 | 5.13 | 5.16 | 5.16 | 5.16 | 5.16 | 5.16 |
| PV UFCF | ||||||||||
| SUM PV UFCF | 3,558.2 | |||||||||
| Long Term Growth Rate, % | 2.00 | |||||||||
| Free cash flow (T + 1) | 1,275 | |||||||||
| Terminal Value | 40,399 | |||||||||
| Present Terminal Value | 31,421 | |||||||||
| Enterprise Value | 34,979 | |||||||||
| Net Debt | 730 | |||||||||
| Equity Value | 34,250 | |||||||||
| Diluted Shares Outstanding, MM | 7,123 | |||||||||
| Equity Value Per Share | 4.81 |
What You Will Receive
- Adjustable Forecast Inputs: Effortlessly modify key assumptions (growth %, margins, WACC) to generate various scenarios.
- Live Market Data: Pre-loaded financial information for Shoucheng Holdings Limited (0697HK) to kickstart your analysis.
- Automated DCF Outputs: The model computes Net Present Value (NPV) and intrinsic value automatically.
- Customizable and Professional Design: A sleek Excel template tailored to meet your valuation requirements.
- Designed for Analysts and Investors: Perfect for testing forecasts, validating strategies, and enhancing efficiency.
Key Features
- 🔍 Real-Life SHOU Financials: Pre-filled historical and projected data for Shoucheng Holdings Limited (0697HK).
- ✏️ Fully Customizable Inputs: Modify all essential parameters (yellow cells) such as WACC, growth %, and tax rates.
- 📊 Professional DCF Valuation: Integrated formulas compute Shoucheng's intrinsic value using the Discounted Cash Flow method.
- ⚡ Instant Results: Visualize Shoucheng's valuation instantly after making adjustments.
- Scenario Analysis: Evaluate and compare outcomes for different financial assumptions side-by-side.
How It Works
- Step 1: Download the Excel file for Shoucheng Holdings Limited (0697HK).
- Step 2: Review the pre-filled financial data and forecasts for Shoucheng Holdings Limited (0697HK).
- Step 3: Adjust key inputs, such as revenue growth, WACC, and tax rates (highlighted cells) for Shoucheng Holdings Limited (0697HK).
- Step 4: Observe the DCF model update in real-time as you modify assumptions for Shoucheng Holdings Limited (0697HK).
- Step 5: Evaluate the outputs and leverage the results for investment decisions related to Shoucheng Holdings Limited (0697HK).
Why Choose Shoucheng Holdings Limited (0697HK) Calculator?
- Time-Saving: Skip the hassle of building a DCF model from the ground up – it's all set for you.
- Enhanced Accuracy: Dependable financial data and formulas minimize valuation errors.
- Completely Customizable: Adjust the model to align with your own assumptions and forecasts.
- Simple to Understand: Intuitive charts and outputs simplify result analysis.
- Endorsed by Professionals: Crafted for experts who prioritize precision and user-friendliness.
Who Can Benefit from This Product?
- Finance Students: Master valuation techniques and practice them with real-world data.
- Researchers: Integrate industry-standard models into your academic studies or research projects.
- Investors: Validate your own assumptions and evaluate valuation projections for Shoucheng Holdings Limited (0697HK).
- Market Analysts: Enhance your efficiency with a ready-made, customizable DCF model.
- Entrepreneurs: Discover how major public companies, such as Shoucheng Holdings Limited (0697HK), are analyzed in the market.
Contents of the Template
- Pre-Filled DCF Model: Shoucheng Holdings Limited’s financial data preloaded for immediate application.
- WACC Calculator: Comprehensive calculations for Weighted Average Cost of Capital.
- Financial Ratios: Analyze Shoucheng Holdings Limited’s profitability, leverage, and efficiency.
- Editable Inputs: Modify assumptions such as growth rates, margins, and CAPEX to align with your scenarios.
- Financial Statements: Access annual and quarterly reports for thorough analysis.
- Interactive Dashboard: Effortlessly visualize essential valuation metrics and outcomes.
Disclaimer
All information, articles, and product details provided on this website are for general informational and educational purposes only. We do not claim any ownership over, nor do we intend to infringe upon, any trademarks, copyrights, logos, brand names, or other intellectual property mentioned or depicted on this site. Such intellectual property remains the property of its respective owners, and any references here are made solely for identification or informational purposes, without implying any affiliation, endorsement, or partnership.
We make no representations or warranties, express or implied, regarding the accuracy, completeness, or suitability of any content or products presented. Nothing on this website should be construed as legal, tax, investment, financial, medical, or other professional advice. In addition, no part of this site—including articles or product references—constitutes a solicitation, recommendation, endorsement, advertisement, or offer to buy or sell any securities, franchises, or other financial instruments, particularly in jurisdictions where such activity would be unlawful.
All content is of a general nature and may not address the specific circumstances of any individual or entity. It is not a substitute for professional advice or services. Any actions you take based on the information provided here are strictly at your own risk. You accept full responsibility for any decisions or outcomes arising from your use of this website and agree to release us from any liability in connection with your use of, or reliance upon, the content or products found herein.