
|
China Resources Power Holdings Company Limited (0836.hk) Valation DCF |
Entièrement Modifiable: Adapté À Vos Besoins Dans Excel Ou Sheets
Conception Professionnelle: Modèles Fiables Et Conformes Aux Normes Du Secteur
Pré-Construits Pour Une Utilisation Rapide Et Efficace
Compatible MAC/PC, entièrement débloqué
Aucune Expertise N'Est Requise; Facile À Suivre
China Resources Power Holdings Company Limited (0836.HK) Bundle
Découvrez le véritable potentiel de China Resources Power Holdings Company Limited (0836HK) avec notre calculatrice DCF de qualité professionnelle! Ajustez les hypothèses clés, explorez divers scénarios et examinez comment les différents changements affectent l'évaluation de China Resources Power Holdings Company Limited (0836HK) - le tout dans un seul modèle Excel.
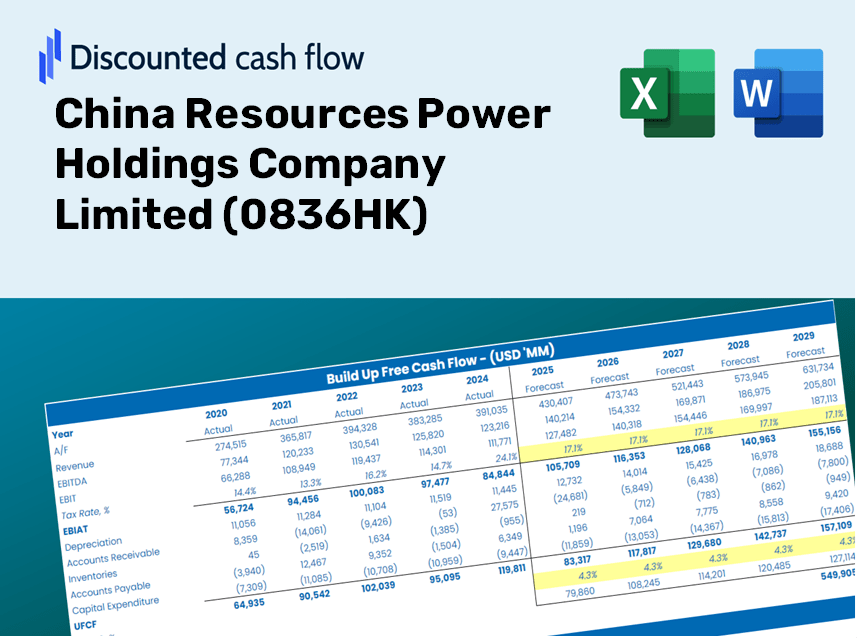
Discounted Cash Flow (DCF) - (USD MM)
| Year | AY1 2020 |
AY2 2021 |
AY3 2022 |
AY4 2023 |
AY5 2024 |
FY1 2025 |
FY2 2026 |
FY3 2027 |
FY4 2028 |
FY5 2029 |
|---|---|---|---|---|---|---|---|---|---|---|
| Revenue | 69,550.8 | 90,414.2 | 103,305.1 | 103,334.3 | 105,284.3 | 117,436.8 | 130,992.0 | 146,111.8 | 162,976.9 | 181,788.6 |
| Revenue Growth, % | 0 | 30 | 14.26 | 0.02828999 | 1.89 | 11.54 | 11.54 | 11.54 | 11.54 | 11.54 |
| EBITDA | 26,466.5 | 20,711.3 | 27,980.7 | 34,385.4 | 38,961.5 | 37,187.1 | 41,479.4 | 46,267.2 | 51,607.7 | 57,564.5 |
| EBITDA, % | 38.05 | 22.91 | 27.09 | 33.28 | 37.01 | 31.67 | 31.67 | 31.67 | 31.67 | 31.67 |
| Depreciation | 11,712.7 | 14,619.1 | 14,429.6 | 14,720.2 | 16,417.4 | 18,042.1 | 20,124.6 | 22,447.5 | 25,038.5 | 27,928.6 |
| Depreciation, % | 16.84 | 16.17 | 13.97 | 14.25 | 15.59 | 15.36 | 15.36 | 15.36 | 15.36 | 15.36 |
| EBIT | 14,753.8 | 6,092.3 | 13,551.1 | 19,665.2 | 22,544.2 | 19,145.0 | 21,354.9 | 23,819.8 | 26,569.2 | 29,635.9 |
| EBIT, % | 21.21 | 6.74 | 13.12 | 19.03 | 21.41 | 16.3 | 16.3 | 16.3 | 16.3 | 16.3 |
| Total Cash | 5,036.5 | 7,934.2 | 7,721.3 | 4,083.0 | 5,834.3 | 7,747.0 | 8,641.2 | 9,638.6 | 10,751.2 | 11,992.2 |
| Total Cash, percent | .0 | .0 | .0 | .0 | .0 | .0 | .0 | .0 | .0 | .0 |
| Account Receivables | 31,418.4 | 36,718.5 | 33,132.4 | 32,826.0 | 40,755.8 | 44,234.7 | 49,340.6 | 55,035.7 | 61,388.3 | 68,474.0 |
| Account Receivables, % | 45.17 | 40.61 | 32.07 | 31.77 | 38.71 | 37.67 | 37.67 | 37.67 | 37.67 | 37.67 |
| Inventories | 2,911.5 | 6,748.3 | 4,581.6 | 4,016.9 | 5,074.0 | 5,822.9 | 6,495.0 | 7,244.7 | 8,080.9 | 9,013.6 |
| Inventories, % | 4.19 | 7.46 | 4.44 | 3.89 | 4.82 | 4.96 | 4.96 | 4.96 | 4.96 | 4.96 |
| Accounts Payable | 9,127.7 | 11,193.5 | 8,205.4 | 6,017.0 | 6,859.8 | 10,753.8 | 11,995.0 | 13,379.6 | 14,923.9 | 16,646.5 |
| Accounts Payable, % | 13.12 | 12.38 | 7.94 | 5.82 | 6.52 | 9.16 | 9.16 | 9.16 | 9.16 | 9.16 |
| Capital Expenditure | -30,528.7 | -25,688.9 | -32,579.8 | -38,776.7 | -49,699.7 | -44,291.2 | -49,403.6 | -55,106.0 | -61,466.7 | -68,561.5 |
| Capital Expenditure, % | -43.89 | -28.41 | -31.54 | -37.53 | -47.21 | -37.71 | -37.71 | -37.71 | -37.71 | -37.71 |
| Tax Rate, % | 24.69 | 24.69 | 24.69 | 24.69 | 24.69 | 24.69 | 24.69 | 24.69 | 24.69 | 24.69 |
| EBITAT | 9,753.3 | 5,446.3 | 10,086.5 | 13,961.0 | 16,977.8 | 14,406.2 | 16,069.1 | 17,923.8 | 19,992.7 | 22,300.4 |
| Depreciation | ||||||||||
| Changes in Account Receivables | ||||||||||
| Changes in Inventories | ||||||||||
| Changes in Accounts Payable | ||||||||||
| Capital Expenditure | ||||||||||
| UFCF | -34,264.9 | -12,694.6 | -5,299.1 | -11,412.9 | -24,448.4 | -12,176.9 | -17,746.6 | -19,795.0 | -22,079.9 | -24,628.4 |
| WACC, % | 3.61 | 4.19 | 3.82 | 3.73 | 3.84 | 3.84 | 3.84 | 3.84 | 3.84 | 3.84 |
| PV UFCF | ||||||||||
| SUM PV UFCF | -85,258.8 | |||||||||
| Long Term Growth Rate, % | 2.00 | |||||||||
| Free cash flow (T + 1) | -25,121 | |||||||||
| Terminal Value | -1,366,655 | |||||||||
| Present Terminal Value | -1,132,073 | |||||||||
| Enterprise Value | -1,217,332 | |||||||||
| Net Debt | 188,322 | |||||||||
| Equity Value | -1,405,654 | |||||||||
| Diluted Shares Outstanding, MM | 4,851 | |||||||||
| Equity Value Per Share | -289.76 |
Benefits of Choosing Us
- Authentic 0836HK Financial Data: Pre-loaded with China Resources Power's historical and projected figures for accurate analysis.
- Completely Customizable Template: Easily adjust essential inputs such as revenue growth, WACC, and EBITDA %.
- Instant Calculations: Watch the intrinsic value of China Resources Power update in real-time as you make adjustments.
- Professional Valuation Tool: Tailored for investors, analysts, and consultants aiming for reliable DCF outcomes.
- Intuitive Design: A straightforward structure and clear guidelines suitable for users of all experience levels.
Key Features
- Real-Life CRP Data: Pre-filled with China Resources Power’s historical financial performance and future projections.
- Fully Customizable Inputs: Tailor revenue growth, margins, WACC, tax rates, and capital expenditures to fit your analysis.
- Dynamic Valuation Model: Automatically updates the Net Present Value (NPV) and intrinsic value based on your entered data.
- Scenario Testing: Develop various forecast scenarios to explore different valuation results.
- User-Friendly Design: Intuitive and organized layout, accommodating both professionals and newcomers to financial analysis.
How It Works
- Step 1: Download the Excel spreadsheet.
- Step 2: Examine China Resources Power's pre-filled financial data and projections.
- Step 3: Adjust essential inputs such as revenue growth, WACC, and tax rates (highlighted cells).
- Step 4: Observe the DCF model refresh in real-time as you modify your assumptions.
- Step 5: Evaluate the outputs and leverage the results for your investment strategies.
Why Opt for This Calculator?
- All-in-One Solution: Features DCF, WACC, and a range of financial ratio analyses within a single interface.
- Flexible Inputs: Modify the highlighted cells to evaluate different scenarios.
- In-Depth Analysis: Automatically computes the intrinsic value and Net Present Value for China Resources Power Holdings Company Limited (0836HK).
- Data Ready: Comes with both historical and projected data for precise initial assessments.
- High Standards: Perfectly suited for financial analysts, investors, and business consultants.
Who Should Utilize This Product?
- Institutional Investors: Create comprehensive and precise valuation models for investment assessment.
- Corporate Finance Departments: Evaluate valuation scenarios to inform internal strategic decisions.
- Consultants and Financial Advisors: Deliver accurate valuation insights for China Resources Power Holdings Company Limited (0836HK) to clients.
- Academic Students and Educators: Leverage real-world data for hands-on experience in financial modeling and education.
- Energy Sector Enthusiasts: Gain insights into the valuation processes of energy companies like China Resources Power Holdings Company Limited (0836HK).
Contents of the Template
- Comprehensive DCF Model: Editable template featuring in-depth valuation calculations.
- Real-World Data: Historical and projected financials for China Resources Power Holdings Company Limited (0836HK) preloaded for analysis.
- Customizable Parameters: Modify WACC, growth rates, and tax assumptions for scenario testing.
- Financial Statements: Complete annual and quarterly breakdowns for enhanced insights.
- Key Ratios: Integrated analysis for profitability, efficiency, and leverage metrics.
- Dashboard with Visual Outputs: Charts and tables providing clear, actionable results.
Disclaimer
All information, articles, and product details provided on this website are for general informational and educational purposes only. We do not claim any ownership over, nor do we intend to infringe upon, any trademarks, copyrights, logos, brand names, or other intellectual property mentioned or depicted on this site. Such intellectual property remains the property of its respective owners, and any references here are made solely for identification or informational purposes, without implying any affiliation, endorsement, or partnership.
We make no representations or warranties, express or implied, regarding the accuracy, completeness, or suitability of any content or products presented. Nothing on this website should be construed as legal, tax, investment, financial, medical, or other professional advice. In addition, no part of this site—including articles or product references—constitutes a solicitation, recommendation, endorsement, advertisement, or offer to buy or sell any securities, franchises, or other financial instruments, particularly in jurisdictions where such activity would be unlawful.
All content is of a general nature and may not address the specific circumstances of any individual or entity. It is not a substitute for professional advice or services. Any actions you take based on the information provided here are strictly at your own risk. You accept full responsibility for any decisions or outcomes arising from your use of this website and agree to release us from any liability in connection with your use of, or reliance upon, the content or products found herein.