
|
Groupe Karnov AB (0A39.l) Évaluation DCF |
Entièrement Modifiable: Adapté À Vos Besoins Dans Excel Ou Sheets
Conception Professionnelle: Modèles Fiables Et Conformes Aux Normes Du Secteur
Pré-Construits Pour Une Utilisation Rapide Et Efficace
Compatible MAC/PC, entièrement débloqué
Aucune Expertise N'Est Requise; Facile À Suivre
Karnov Group AB (publ) (0A39.L) Bundle
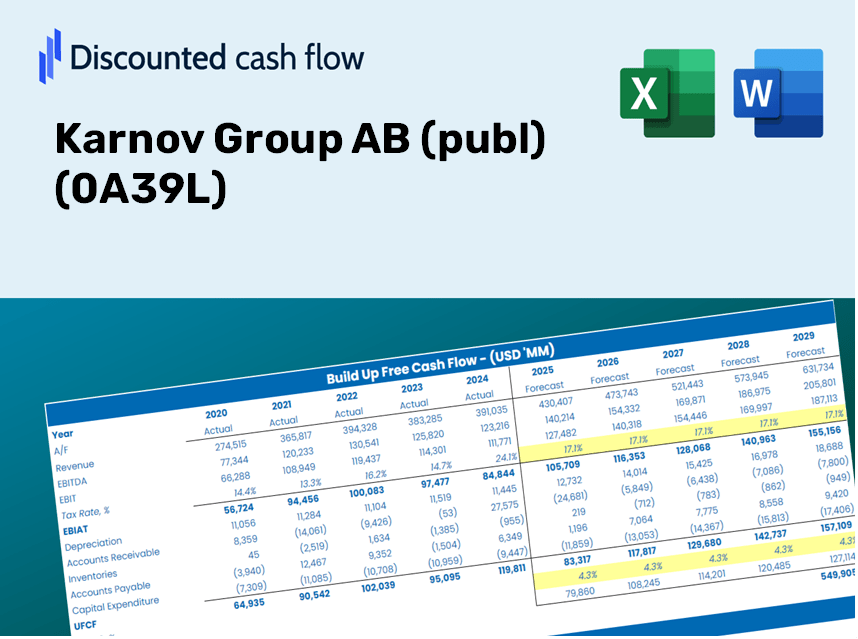
Explorez les perspectives financières de Karnov Group AB (Publ) (0A39L) avec notre calculatrice DCF conviviale! Entrez vos hypothèses pour la croissance, les marges et les dépenses pour calculer la valeur intrinsèque du groupe Karnov AB (Publ) (0A39L) et informer vos décisions d'investissement.
Discounted Cash Flow (DCF) - (USD MM)
| Year | AY1 2020 |
AY2 2021 |
AY3 2022 |
AY4 2023 |
AY5 2024 |
FY1 2025 |
FY2 2026 |
FY3 2027 |
FY4 2028 |
FY5 2029 |
|---|---|---|---|---|---|---|---|---|---|---|
| Revenue | 771.4 | 878.1 | 1,113.5 | 2,474.6 | 2,592.7 | 2,617.6 | 2,642.8 | 2,668.2 | 2,693.9 | 2,719.8 |
| Revenue Growth, % | 0 | 13.83 | 26.81 | 122.24 | 4.77 | 0.96168 | 0.96168 | 0.96168 | 0.96168 | 0.96168 |
| EBITDA | 335.9 | 331.9 | 330.1 | 559.5 | 547.7 | 810.0 | 817.8 | 825.7 | 833.6 | 841.6 |
| EBITDA, % | 43.55 | 37.79 | 29.65 | 22.61 | 21.12 | 30.94 | 30.94 | 30.94 | 30.94 | 30.94 |
| Depreciation | 190.4 | 208.6 | 233.8 | 367.8 | 385.5 | 519.2 | 524.2 | 529.2 | 534.3 | 539.4 |
| Depreciation, % | 24.68 | 23.76 | 21 | 14.86 | 14.87 | 19.83 | 19.83 | 19.83 | 19.83 | 19.83 |
| EBIT | 145.5 | 123.3 | 96.3 | 191.7 | 162.2 | 290.8 | 293.6 | 296.5 | 299.3 | 302.2 |
| EBIT, % | 18.87 | 14.04 | 8.65 | 7.75 | 6.26 | 11.11 | 11.11 | 11.11 | 11.11 | 11.11 |
| Total Cash | 552.9 | 951.5 | 671.2 | 450.6 | 402.8 | 1,391.0 | 1,404.4 | 1,417.9 | 1,431.5 | 1,445.3 |
| Total Cash, percent | .0 | .0 | .0 | .0 | .0 | .0 | .0 | .0 | .0 | .0 |
| Account Receivables | 149.2 | 198.5 | 411.5 | 422.5 | 523.4 | 608.1 | 614.0 | 619.9 | 625.9 | 631.9 |
| Account Receivables, % | 19.34 | 22.61 | 36.96 | 17.07 | 20.19 | 23.23 | 23.23 | 23.23 | 23.23 | 23.23 |
| Inventories | 10.0 | 11.7 | 20.5 | 18.7 | 18.8 | 31.1 | 31.4 | 31.7 | 32.0 | 32.3 |
| Inventories, % | 1.3 | 1.33 | 1.84 | 0.75568 | 0.72511 | 1.19 | 1.19 | 1.19 | 1.19 | 1.19 |
| Accounts Payable | 12.4 | 25.7 | 137.6 | 111.3 | 111.9 | 134.6 | 135.8 | 137.2 | 138.5 | 139.8 |
| Accounts Payable, % | 1.61 | 2.92 | 12.36 | 4.5 | 4.32 | 5.14 | 5.14 | 5.14 | 5.14 | 5.14 |
| Capital Expenditure | -82.6 | -63.4 | -93.1 | -163.0 | -167.7 | -206.0 | -207.9 | -209.9 | -212.0 | -214.0 |
| Capital Expenditure, % | -10.71 | -7.22 | -8.36 | -6.59 | -6.47 | -7.87 | -7.87 | -7.87 | -7.87 | -7.87 |
| Tax Rate, % | 1.19 | 1.19 | 1.19 | 1.19 | 1.19 | 1.19 | 1.19 | 1.19 | 1.19 | 1.19 |
| EBITAT | 120.6 | 101.5 | 115.3 | 212.9 | 160.3 | 269.9 | 272.5 | 275.1 | 277.8 | 280.4 |
| Depreciation | ||||||||||
| Changes in Account Receivables | ||||||||||
| Changes in Inventories | ||||||||||
| Changes in Accounts Payable | ||||||||||
| Capital Expenditure | ||||||||||
| UFCF | 81.5 | 209.0 | 146.1 | 382.2 | 277.7 | 508.7 | 583.8 | 589.5 | 595.1 | 600.9 |
| WACC, % | 6.38 | 6.37 | 6.62 | 6.62 | 6.6 | 6.52 | 6.52 | 6.52 | 6.52 | 6.52 |
| PV UFCF | ||||||||||
| SUM PV UFCF | 2,380.5 | |||||||||
| Long Term Growth Rate, % | 3.50 | |||||||||
| Free cash flow (T + 1) | 622 | |||||||||
| Terminal Value | 20,621 | |||||||||
| Present Terminal Value | 15,040 | |||||||||
| Enterprise Value | 17,421 | |||||||||
| Net Debt | 2,467 | |||||||||
| Equity Value | 14,953 | |||||||||
| Diluted Shares Outstanding, MM | 108 | |||||||||
| Equity Value Per Share | 138.61 |
What You Will Receive
- Genuine Karnov Data: Comprehensive financials – covering everything from revenue to EBIT – sourced from actual and projected metrics.
- Complete Customization: Modify all key parameters (yellow cells) such as WACC, growth rates, and tax percentages.
- Real-Time Valuation Adjustments: Automatic recalculations to assess the effects of changes on Karnov Group AB’s fair value.
- Flexible Excel Template: Designed for quick modifications, scenario analysis, and thorough projections.
- Efficient and Precise: Eliminate the need to build models from the ground up while ensuring accuracy and adaptability.
Key Features
- Comprehensive KARN Data: Pre-loaded with Karnov Group AB’s historical financial performance and future forecasts.
- Customizable Parameters: Modify growth rates, profit margins, discount rates, tax percentages, and capital investment plans.
- Flexible Valuation Framework: Automatically recalculates Net Present Value (NPV) and intrinsic value according to your specified parameters.
- Scenario Analysis: Develop various predictive scenarios to evaluate different valuation results.
- User-Centric Interface: Intuitive, organized, and suitable for both professionals and beginners.
How It Functions
- Download: Obtain the pre-configured Excel file containing Karnov Group AB’s (0A39L) financial data.
- Customize: Tailor your forecasts, including revenue growth, EBITDA %, and WACC.
- Update Automatically: Real-time updates for intrinsic value and NPV calculations.
- Test Scenarios: Generate various projections and compare results immediately.
- Make Decisions: Utilize the valuation outcomes to inform your investment strategy.
Why Opt for Karnov Group AB (0A39L)?
- Time-Saving: Skip the hassle of building a DCF model from the ground up – it’s all set for you.
- Enhanced Accuracy: Dependable financial data and calculations minimize valuation errors.
- Completely Customizable: Adjust the model to suit your unique assumptions and forecasts.
- User-Friendly: Intuitive charts and outputs facilitate straightforward analysis of results.
- Endorsed by Professionals: Crafted for experts who prioritize accuracy and functionality.
Who Can Benefit from This Product?
- Finance Students: Master valuation methods and apply them to real-world data.
- Academics: Integrate professional valuation models into your teaching or research projects.
- Investors: Evaluate your assumptions and assess valuation results for Karnov Group AB (0A39L).
- Analysts: Enhance your efficiency with a ready-made, customizable DCF model.
- Small Business Owners: Understand the analytical processes used for evaluating large public companies like Karnov Group AB (0A39L).
Contents of the Template
- Pre-Filled Data: Features Karnov Group AB's historical financials and projections.
- Discounted Cash Flow Model: An editable DCF valuation model with automatic calculations.
- Weighted Average Cost of Capital (WACC): A specific sheet designed for calculating WACC based on user-defined inputs.
- Key Financial Ratios: Evaluate Karnov Group AB's profitability, efficiency, and leverage metrics.
- Customizable Inputs: Easily modify revenue growth, margins, and tax rates to suit your analysis.
- Clear Dashboard: Visual charts and tables summarizing essential valuation outcomes.
Disclaimer
All information, articles, and product details provided on this website are for general informational and educational purposes only. We do not claim any ownership over, nor do we intend to infringe upon, any trademarks, copyrights, logos, brand names, or other intellectual property mentioned or depicted on this site. Such intellectual property remains the property of its respective owners, and any references here are made solely for identification or informational purposes, without implying any affiliation, endorsement, or partnership.
We make no representations or warranties, express or implied, regarding the accuracy, completeness, or suitability of any content or products presented. Nothing on this website should be construed as legal, tax, investment, financial, medical, or other professional advice. In addition, no part of this site—including articles or product references—constitutes a solicitation, recommendation, endorsement, advertisement, or offer to buy or sell any securities, franchises, or other financial instruments, particularly in jurisdictions where such activity would be unlawful.
All content is of a general nature and may not address the specific circumstances of any individual or entity. It is not a substitute for professional advice or services. Any actions you take based on the information provided here are strictly at your own risk. You accept full responsibility for any decisions or outcomes arising from your use of this website and agree to release us from any liability in connection with your use of, or reliance upon, the content or products found herein.