
|
Siemens Healthineers AG (0 PMJ.L) Évaluation DCF |
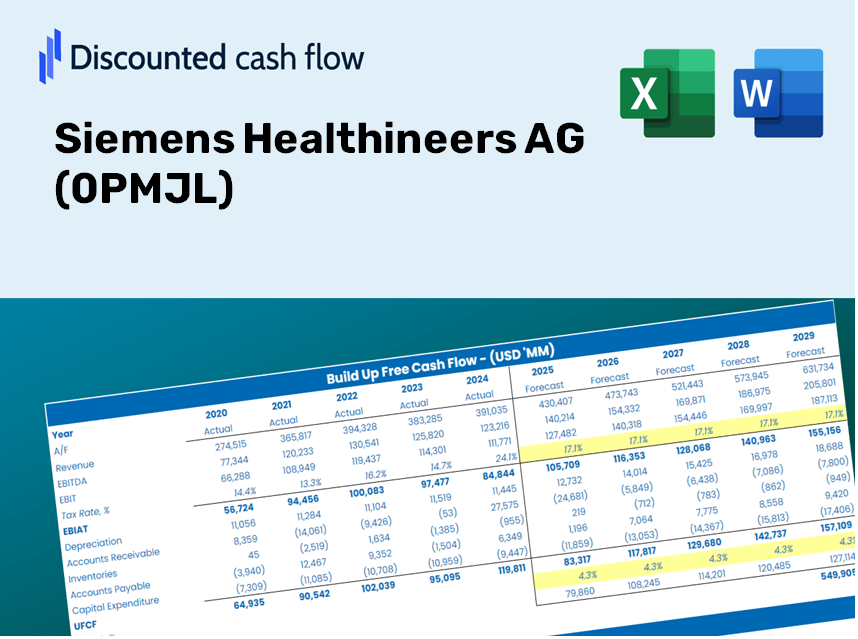
Entièrement Modifiable: Adapté À Vos Besoins Dans Excel Ou Sheets
Conception Professionnelle: Modèles Fiables Et Conformes Aux Normes Du Secteur
Pré-Construits Pour Une Utilisation Rapide Et Efficace
Compatible MAC/PC, entièrement débloqué
Aucune Expertise N'Est Requise; Facile À Suivre
Siemens Healthineers AG (0PMJ.L) Bundle
Conçu pour la précision, notre calculatrice DCF Siemens Healthineers AG (0pmjl) vous permet d'évaluer l'évaluation de l'entreprise à l'aide de données financières réelles, tout en offrant une flexibilité complète pour modifier tous les paramètres essentiels pour des projections améliorées.
Discounted Cash Flow (DCF) - (USD MM)
| Year | AY1 2020 |
AY2 2021 |
AY3 2022 |
AY4 2023 |
AY5 2024 |
FY1 2025 |
FY2 2026 |
FY3 2027 |
FY4 2028 |
FY5 2029 |
|---|---|---|---|---|---|---|---|---|---|---|
| Revenue | 14,460.0 | 17,997.0 | 21,714.0 | 21,680.0 | 22,363.0 | 25,052.6 | 28,065.7 | 31,441.1 | 35,222.5 | 39,458.7 |
| Revenue Growth, % | 0 | 24.46 | 20.65 | -0.15658 | 3.15 | 12.03 | 12.03 | 12.03 | 12.03 | 12.03 |
| EBITDA | 2,842.0 | 3,521.0 | 4,259.0 | 3,778.0 | 4,224.0 | 4,767.4 | 5,340.7 | 5,983.1 | 6,702.6 | 7,508.8 |
| EBITDA, % | 19.65 | 19.56 | 19.61 | 17.43 | 18.89 | 19.03 | 19.03 | 19.03 | 19.03 | 19.03 |
| Depreciation | 815.0 | 1,039.0 | 1,343.0 | 1,557.0 | 1,223.0 | 1,515.4 | 1,697.7 | 1,901.9 | 2,130.6 | 2,386.9 |
| Depreciation, % | 5.64 | 5.77 | 6.18 | 7.18 | 5.47 | 6.05 | 6.05 | 6.05 | 6.05 | 6.05 |
| EBIT | 2,027.0 | 2,482.0 | 2,916.0 | 2,221.0 | 3,001.0 | 3,251.9 | 3,643.0 | 4,081.2 | 4,572.0 | 5,121.9 |
| EBIT, % | 14.02 | 13.79 | 13.43 | 10.24 | 13.42 | 12.98 | 12.98 | 12.98 | 12.98 | 12.98 |
| Total Cash | 656.0 | 1,322.0 | 1,436.0 | 1,642.0 | 2,683.0 | 1,907.3 | 2,136.7 | 2,393.7 | 2,681.6 | 3,004.1 |
| Total Cash, percent | .0 | .0 | .0 | .0 | .0 | .0 | .0 | .0 | .0 | .0 |
| Account Receivables | 7,080.0 | 6,012.0 | 7,064.0 | 7,484.0 | 7,205.0 | 9,101.0 | 10,195.6 | 11,421.9 | 12,795.6 | 14,334.5 |
| Account Receivables, % | 48.96 | 33.41 | 32.53 | 34.52 | 32.22 | 36.33 | 36.33 | 36.33 | 36.33 | 36.33 |
| Inventories | 2,305.0 | 3,180.0 | 4,009.0 | 4,294.0 | 4,179.0 | 4,537.8 | 5,083.6 | 5,695.0 | 6,379.9 | 7,147.3 |
| Inventories, % | 15.94 | 17.67 | 18.46 | 19.81 | 18.69 | 18.11 | 18.11 | 18.11 | 18.11 | 18.11 |
| Accounts Payable | 1,356.0 | 1,921.0 | 2,315.0 | 2,203.0 | 2,126.0 | 2,524.4 | 2,828.0 | 3,168.1 | 3,549.1 | 3,975.9 |
| Accounts Payable, % | 9.38 | 10.67 | 10.66 | 10.16 | 9.51 | 10.08 | 10.08 | 10.08 | 10.08 | 10.08 |
| Capital Expenditure | -557.0 | -674.0 | -852.0 | -838.0 | -696.0 | -926.9 | -1,038.3 | -1,163.2 | -1,303.1 | -1,459.8 |
| Capital Expenditure, % | -3.85 | -3.75 | -3.92 | -3.87 | -3.11 | -3.7 | -3.7 | -3.7 | -3.7 | -3.7 |
| Tax Rate, % | 23.03 | 23.03 | 23.03 | 23.03 | 23.03 | 23.03 | 23.03 | 23.03 | 23.03 | 23.03 |
| EBITAT | 1,463.7 | 1,783.0 | 2,122.4 | 1,738.3 | 2,309.9 | 2,419.9 | 2,711.0 | 3,037.0 | 3,402.3 | 3,811.5 |
| Depreciation | ||||||||||
| Changes in Account Receivables | ||||||||||
| Changes in Inventories | ||||||||||
| Changes in Accounts Payable | ||||||||||
| Capital Expenditure | ||||||||||
| UFCF | -6,307.3 | 2,906.0 | 1,126.4 | 1,640.3 | 3,153.9 | 1,152.0 | 2,033.6 | 2,278.2 | 2,552.2 | 2,859.1 |
| WACC, % | 6.48 | 6.47 | 6.48 | 6.53 | 6.52 | 6.5 | 6.5 | 6.5 | 6.5 | 6.5 |
| PV UFCF | ||||||||||
| SUM PV UFCF | 8,832.0 | |||||||||
| Long Term Growth Rate, % | 3.00 | |||||||||
| Free cash flow (T + 1) | 2,945 | |||||||||
| Terminal Value | 84,209 | |||||||||
| Present Terminal Value | 61,471 | |||||||||
| Enterprise Value | 70,303 | |||||||||
| Net Debt | 13,526 | |||||||||
| Equity Value | 56,777 | |||||||||
| Diluted Shares Outstanding, MM | 1,123 | |||||||||
| Equity Value Per Share | 50.54 |
Benefits You Will Receive
- Authentic SHL Financial Data: Pre-loaded with Siemens Healthineers' historical and forecasted data for accurate analysis.
- Completely Customizable Template: Effortlessly adjust essential inputs like revenue growth, WACC, and EBITDA percentage.
- Instant Calculations: Watch as the intrinsic value of Siemens Healthineers updates in real-time with your modifications.
- Expert Valuation Tool: Crafted for investors, analysts, and consultants aiming for precise DCF outcomes.
- Accessible Design: Intuitive layout and straightforward instructions suitable for users of all skill levels.
Key Features
- Comprehensive Siemens Healthineers Data: Pre-populated with historical financials and future projections for Siemens Healthineers AG (0PMJL).
- Customizable Parameters: Tailor revenue growth, profit margins, WACC, tax rates, and capital investments to fit your analysis.
- Interactive Valuation Model: Automatic recalculations of Net Present Value (NPV) and intrinsic value based on your inputs.
- Scenario Analysis: Develop various forecast scenarios to explore different investment outcomes.
- Intuitive Interface: Designed with a user-friendly layout suitable for both experienced professionals and novices.
How It Operates
- Step 1: Download the ready-to-use Excel template featuring data for Siemens Healthineers AG (0PMJL).
- Step 2: Review the pre-populated sheets to familiarize yourself with the essential metrics.
- Step 3: Modify forecasts and assumptions in the editable yellow cells (WACC, growth, margins).
- Step 4: Instantly see the recalibrated figures, including Siemens Healthineers AG’s intrinsic value.
- Step 5: Utilize the results to make well-informed investment decisions or to create reports.
Why Opt for This Calculator?
- Designed for Experts: A sophisticated tool utilized by analysts, CFOs, and consultants.
- Real-Time Data: Siemens Healthineers' historical and projected financials preloaded for precision.
- Scenario Analysis: Effortlessly simulate various forecasts and assumptions.
- Clear Results: Automatically computes intrinsic value, NPV, and essential metrics.
- User-Friendly: Step-by-step guidance walks you through the entire process.
Who Can Benefit from Siemens Healthineers AG (0PMJL)?
- Healthcare Investors: Make informed decisions with a professional-grade valuation tool tailored for the healthcare sector.
- Financial Analysts: Streamline your workflow with a customizable DCF model specifically designed for healthcare valuations.
- Consultants: Effortlessly modify the template for client presentations or comprehensive reports in the healthcare industry.
- Healthcare Enthusiasts: Enhance your knowledge of valuation methodologies using real-world examples from Siemens Healthineers AG.
- Educators and Students: Utilize this resource as a hands-on learning aid in finance or healthcare-related courses.
Contents of the Template
- Historical Data: Contains Siemens Healthineers AG's past financial performance and baseline forecasts.
- DCF and Levered DCF Models: Comprehensive templates for calculating the intrinsic value of Siemens Healthineers AG.
- WACC Sheet: Pre-configured calculations for the Weighted Average Cost of Capital.
- Editable Inputs: Adjust key variables such as growth rates, EBITDA percentages, and CAPEX assumptions.
- Quarterly and Annual Statements: A thorough breakdown of Siemens Healthineers AG's financial statements.
- Interactive Dashboard: Dynamically visualize valuation outcomes and forecasts.
Disclaimer
All information, articles, and product details provided on this website are for general informational and educational purposes only. We do not claim any ownership over, nor do we intend to infringe upon, any trademarks, copyrights, logos, brand names, or other intellectual property mentioned or depicted on this site. Such intellectual property remains the property of its respective owners, and any references here are made solely for identification or informational purposes, without implying any affiliation, endorsement, or partnership.
We make no representations or warranties, express or implied, regarding the accuracy, completeness, or suitability of any content or products presented. Nothing on this website should be construed as legal, tax, investment, financial, medical, or other professional advice. In addition, no part of this site—including articles or product references—constitutes a solicitation, recommendation, endorsement, advertisement, or offer to buy or sell any securities, franchises, or other financial instruments, particularly in jurisdictions where such activity would be unlawful.
All content is of a general nature and may not address the specific circumstances of any individual or entity. It is not a substitute for professional advice or services. Any actions you take based on the information provided here are strictly at your own risk. You accept full responsibility for any decisions or outcomes arising from your use of this website and agree to release us from any liability in connection with your use of, or reliance upon, the content or products found herein.