
|
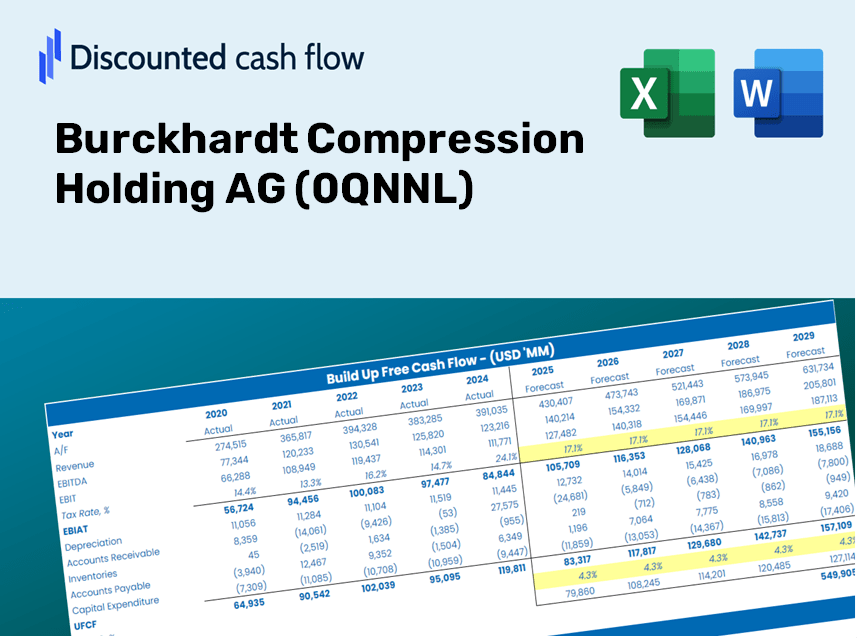
Burckhardt Compression Holding Ag (0qnn.l) Valation DCF |
Entièrement Modifiable: Adapté À Vos Besoins Dans Excel Ou Sheets
Conception Professionnelle: Modèles Fiables Et Conformes Aux Normes Du Secteur
Pré-Construits Pour Une Utilisation Rapide Et Efficace
Compatible MAC/PC, entièrement débloqué
Aucune Expertise N'Est Requise; Facile À Suivre
Burckhardt Compression Holding AG (0QNN.L) Bundle
Conçu pour la précision, notre calculatrice (0qnnl) DCF vous permet d'évaluer la compression Burckhardt tenant l'évaluation de l'AG à l'aide de données financières du monde réel, tout en offrant une flexibilité complète pour modifier tous les paramètres clés pour des projections améliorées.
Benefits You Will Receive
- Authentic BACH Financial Data: Pre-loaded with Burckhardt Compression's historical and forecasted data for accurate analysis.
- Completely Customizable Template: Easily adjust key inputs such as revenue growth, WACC, and EBITDA percentage.
- Instant Calculations: Watch Burckhardt Compression's intrinsic value update automatically as you make changes.
- Professional Valuation Tool: Tailored for investors, analysts, and consultants in pursuit of reliable DCF results.
- User-Friendly Interface: Straightforward layout and clear guidance suitable for all skill levels.
Key Features
- Actual Burckhardt Compression Data: Comes pre-loaded with historical financials and future projections for Burckhardt Compression Holding AG (0QNNL).
- Customizable Input Options: Tailor revenue growth, profit margins, WACC, tax rates, and capital expenditures to meet your analysis needs.
- Adaptive Valuation Model: Automated updates to Net Present Value (NPV) and intrinsic value based on your customized inputs.
- Scenario Analysis: Generate various forecast scenarios to assess different valuation possibilities.
- Intuitive Interface: Designed with simplicity in mind, suitable for both seasoned professionals and newcomers.
How It Works
- Download: Obtain the pre-formatted Excel file containing Burckhardt Compression Holding AG's (0QNNL) financial data.
- Customize: Modify forecasts such as revenue growth, EBITDA %, and WACC to suit your analysis.
- Update Automatically: Watch as the intrinsic value and NPV calculations refresh in real-time.
- Test Scenarios: Generate various projections and instantly evaluate their outcomes.
- Make Decisions: Leverage the valuation findings to inform your investment strategy.
Why Opt for This Calculator?
- Reliable Data: Authentic Burckhardt Compression financials provide trustworthy valuation outcomes.
- Customizable: Modify essential variables such as growth forecasts, WACC, and tax rates to align with your estimates.
- Time-Efficient: Ready-made calculations save you the hassle of starting from square one.
- Professional-Quality Tool: Tailored for investors, analysts, and consultants.
- User-Friendly: A clear layout and easy-to-follow instructions ensure accessibility for everyone.
Who Can Benefit from This Product?
- Finance Students: Master valuation methods and practice with real-world data.
- Academics: Integrate advanced financial models into your teaching or research projects.
- Investors: Evaluate your own investment assumptions and assess valuation results for Burckhardt Compression Holding AG (0QNNL).
- Analysts: Enhance your efficiency with a customizable and readily available DCF model.
- Small Business Owners: Discover how analysts assess large public firms like Burckhardt Compression Holding AG (0QNNL).
Contents of the Template
- Pre-Filled DCF Model: Burckhardt Compression Holding AG's financial data preloaded for immediate analysis.
- WACC Calculator: Comprehensive calculations for the Weighted Average Cost of Capital.
- Financial Ratios: Assess Burckhardt Compression's profitability, leverage, and operational efficiency.
- Editable Inputs: Modify assumptions such as growth rates, margins, and capital expenditures to tailor your analysis.
- Financial Statements: Access annual and quarterly reports to facilitate in-depth examination.
- Interactive Dashboard: Effortlessly visualize key valuation metrics and outcomes.
Disclaimer
All information, articles, and product details provided on this website are for general informational and educational purposes only. We do not claim any ownership over, nor do we intend to infringe upon, any trademarks, copyrights, logos, brand names, or other intellectual property mentioned or depicted on this site. Such intellectual property remains the property of its respective owners, and any references here are made solely for identification or informational purposes, without implying any affiliation, endorsement, or partnership.
We make no representations or warranties, express or implied, regarding the accuracy, completeness, or suitability of any content or products presented. Nothing on this website should be construed as legal, tax, investment, financial, medical, or other professional advice. In addition, no part of this site—including articles or product references—constitutes a solicitation, recommendation, endorsement, advertisement, or offer to buy or sell any securities, franchises, or other financial instruments, particularly in jurisdictions where such activity would be unlawful.
All content is of a general nature and may not address the specific circumstances of any individual or entity. It is not a substitute for professional advice or services. Any actions you take based on the information provided here are strictly at your own risk. You accept full responsibility for any decisions or outcomes arising from your use of this website and agree to release us from any liability in connection with your use of, or reliance upon, the content or products found herein.