
|
TX GROUP AG (0qo9.l) Valation DCF |
Entièrement Modifiable: Adapté À Vos Besoins Dans Excel Ou Sheets
Conception Professionnelle: Modèles Fiables Et Conformes Aux Normes Du Secteur
Pré-Construits Pour Une Utilisation Rapide Et Efficace
Compatible MAC/PC, entièrement débloqué
Aucune Expertise N'Est Requise; Facile À Suivre
TX Group AG (0QO9.L) Bundle
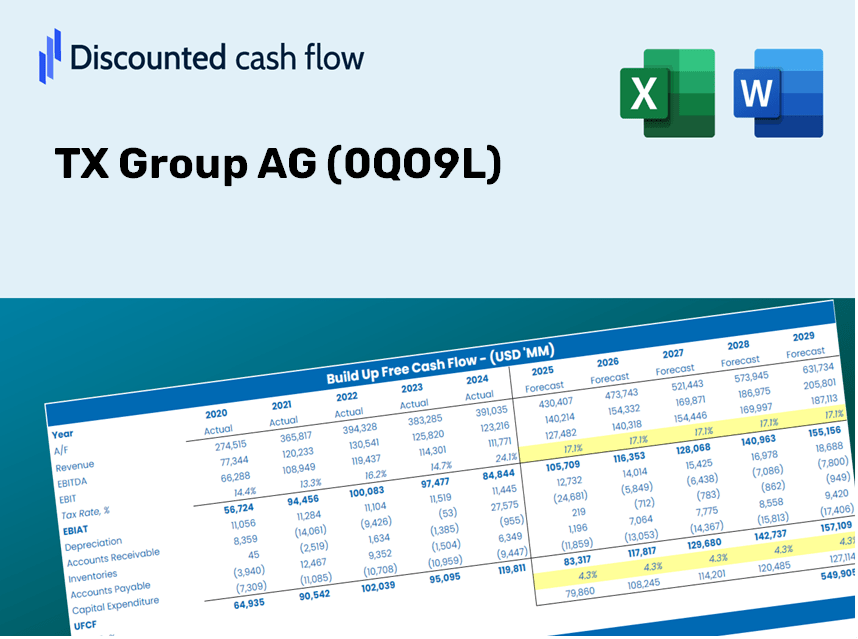
Évaluez les perspectives financières de TX Group AG (0QO9L) avec des outils professionnels! Cette calculatrice DCF (0QO9L) est livrée avec des données financières pré-remplies et offre une flexibilité totale pour modifier la croissance des revenus, le WACC, les marges et d'autres variables essentielles pour s'aligner sur vos prévisions.
What You Will Receive
- Pre-Filled Financial Model: TX Group AG’s (0QO9L) actual data allows for accurate DCF valuation.
- Comprehensive Forecast Control: Modify revenue growth, margins, WACC, and other essential factors.
- Real-Time Calculations: Instant updates provide immediate visibility of results as you make adjustments.
- Professional-Grade Template: A polished Excel file crafted for high-quality valuation presentations.
- Flexible and Reusable: Designed for adaptability, enabling repeated utilization for in-depth forecasts.
Key Features
- 🔍 Real-Life TX Group AG Financials: Pre-loaded historical and projected data for TX Group AG (0QO9L).
- ✏️ Fully Customizable Inputs: Modify all essential parameters (highlighted cells) such as WACC, growth %, and tax rates.
- 📊 Professional DCF Valuation: Integrated formulas determine TX Group AG's intrinsic value using the Discounted Cash Flow approach.
- ⚡ Instant Results: Quickly visualize TX Group AG's valuation updates after adjustments.
- Scenario Analysis: Evaluate and contrast outcomes for different financial assumptions side-by-side.
How It Works
- Step 1: Download the pre-built Excel template that includes TX Group AG’s data.
- Step 2: Review the pre-filled sheets to familiarize yourself with the essential metrics.
- Step 3: Modify the forecasts and assumptions in the editable yellow cells (WACC, growth, margins).
- Step 4: Instantly see the recalculated results, including TX Group AG’s intrinsic value.
- Step 5: Use the outputs to make informed investment decisions or create detailed reports.
Why Choose the TX Group AG (0QO9L) Calculator?
- Time-Efficient: Skip the hassle of building a DCF model from the ground up – it’s ready for immediate use.
- Enhanced Precision: Accurate financial data and formulas minimize valuation errors.
- Completely Customizable: Adjust the model to align with your specific assumptions and forecasts.
- User-Friendly: Intuitive charts and outputs simplify result analysis.
- Endorsed by Professionals: Crafted for those who prioritize accuracy and functionality.
Who Can Benefit from This Product?
- Professional Investors: Create comprehensive and accurate valuation models for portfolio assessments involving TX Group AG (0QO9L).
- Corporate Finance Teams: Evaluate valuation scenarios to inform strategic decisions within the organization.
- Consultants and Advisors: Deliver precise valuation analysis for clients interested in TX Group AG (0QO9L).
- Students and Educators: Utilize actual market data to enhance learning and practice in financial modeling.
- Tech Enthusiasts: Gain insights into the market valuation of technology firms like TX Group AG (0QO9L).
Contents of the Template
- In-Depth DCF Model: An editable template featuring comprehensive valuation calculations.
- Actual Financial Data: TX Group AG's (0QO9L) historical and forecasted financials already included for thorough analysis.
- Adjustable Variables: Modify WACC, growth rates, and tax assumptions to explore various scenarios.
- Detailed Financial Statements: Complete annual and quarterly reports for enhanced understanding.
- Essential Ratios: Integrated analysis for profitability, efficiency, and leverage metrics.
- Interactive Dashboard with Visual Representations: Charts and tables for clear and actionable insights.
Disclaimer
All information, articles, and product details provided on this website are for general informational and educational purposes only. We do not claim any ownership over, nor do we intend to infringe upon, any trademarks, copyrights, logos, brand names, or other intellectual property mentioned or depicted on this site. Such intellectual property remains the property of its respective owners, and any references here are made solely for identification or informational purposes, without implying any affiliation, endorsement, or partnership.
We make no representations or warranties, express or implied, regarding the accuracy, completeness, or suitability of any content or products presented. Nothing on this website should be construed as legal, tax, investment, financial, medical, or other professional advice. In addition, no part of this site—including articles or product references—constitutes a solicitation, recommendation, endorsement, advertisement, or offer to buy or sell any securities, franchises, or other financial instruments, particularly in jurisdictions where such activity would be unlawful.
All content is of a general nature and may not address the specific circumstances of any individual or entity. It is not a substitute for professional advice or services. Any actions you take based on the information provided here are strictly at your own risk. You accept full responsibility for any decisions or outcomes arising from your use of this website and agree to release us from any liability in connection with your use of, or reliance upon, the content or products found herein.