
|
Cembra Money Bank AG (0qpj.l) Évaluation DCF |
Entièrement Modifiable: Adapté À Vos Besoins Dans Excel Ou Sheets
Conception Professionnelle: Modèles Fiables Et Conformes Aux Normes Du Secteur
Pré-Construits Pour Une Utilisation Rapide Et Efficace
Compatible MAC/PC, entièrement débloqué
Aucune Expertise N'Est Requise; Facile À Suivre
Cembra Money Bank AG (0QPJ.L) Bundle
Améliorez vos choix d'investissement avec la calculatrice DCF CEMBRA Money Bank AG (0QPJL)! Plongez dans des données financières authentiques, ajustez les projections et dépenses de croissance et observez instantanément comment ces modifications affectent la valeur intrinsèque de Cembra Money Bank AG (0qpjl).
What You Will Receive
- Customizable Excel Template: A fully adjustable Excel-based DCF Calculator featuring pre-loaded financial data for Cembra Money Bank AG (0QPJL).
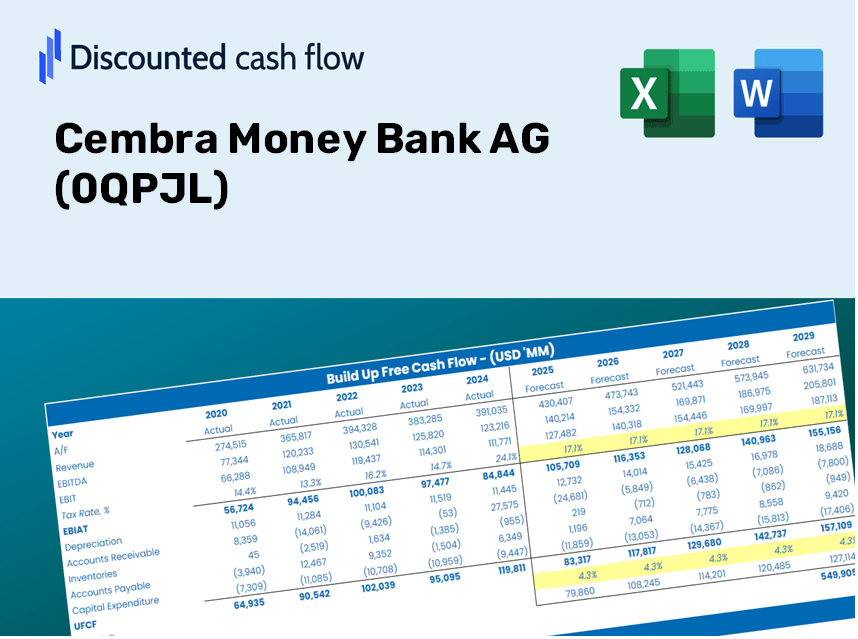
- Authentic Data: Access to historical data and forward-looking projections (highlighted in the yellow cells).
- Flexible Forecasting: Modify forecast parameters such as revenue growth, EBITDA %, and WACC at your discretion.
- Instant Calculations: Quickly observe how your inputs affect the valuation of Cembra Money Bank AG (0QPJL).
- Professional Resource: Designed for use by investors, CFOs, consultants, and financial analysts.
- Easy-to-Use Interface: Organized for simplicity and usability, complete with step-by-step guidance.
Key Features
- 🔍 Real-Life Cembra Money Bank Financials: Pre-filled historical and projected data for Cembra Money Bank AG (0QPJL).
- ✏️ Fully Customizable Inputs: Adjust all critical parameters (yellow cells) such as WACC, growth %, and tax rates.
- 📊 Professional DCF Valuation: Integrated formulas calculate Cembra Money Bank's intrinsic value using the Discounted Cash Flow method.
- ⚡ Instant Results: Visualize Cembra Money Bank's valuation immediately after making adjustments.
- Scenario Analysis: Evaluate and compare different financial assumptions side-by-side.
How It Works
- Step 1: Download the prebuilt Excel template featuring Cembra Money Bank AG's data.
- Step 2: Review the pre-filled sheets to familiarize yourself with essential metrics.
- Step 3: Modify forecasts and assumptions in the editable yellow cells (WACC, growth, margins).
- Step 4: Instantly see updated results, including Cembra Money Bank AG's intrinsic value.
- Step 5: Make well-informed investment choices or create reports based on the results.
Why Opt for This Calculator from Cembra Money Bank AG (0QPJL)?
- Time-Efficient: Skip the hassle of building a DCF model from the ground up – it’s ready for immediate use.
- Enhanced Accuracy: Dependable financial data and formulas minimize valuation errors.
- Completely Customizable: Adjust the model to align with your own assumptions and forecasts.
- Intuitive Analysis: User-friendly charts and outputs simplify the interpretation of results.
- Endorsed by Professionals: Crafted for experts who prioritize both accuracy and functionality.
Who Can Benefit from This Product?
- Finance Students: Master valuation methods and apply them with real-world data.
- Academics: Integrate industry models into your teaching or research projects.
- Investors: Validate your investment hypotheses and examine valuation scenarios for Cembra Money Bank AG (0QPJL).
- Analysts: Enhance your efficiency with a customizable, ready-to-use DCF model.
- Small Business Owners: Discover how major public entities like Cembra Money Bank AG (0QPJL) are evaluated.
Contents of the Template
- Pre-Filled DCF Model: Cembra Money Bank AG's financial data is preloaded for immediate application.
- WACC Calculator: Comprehensive calculations for the Weighted Average Cost of Capital.
- Financial Ratios: Assess Cembra Money Bank AG's profitability, leverage, and operational efficiency.
- Editable Inputs: Adjust assumptions like growth rates, profit margins, and capital expenditures to suit your scenarios.
- Financial Statements: Access annual and quarterly reports for in-depth analysis.
- Interactive Dashboard: Seamlessly visualize key valuation metrics and outcomes.
Disclaimer
All information, articles, and product details provided on this website are for general informational and educational purposes only. We do not claim any ownership over, nor do we intend to infringe upon, any trademarks, copyrights, logos, brand names, or other intellectual property mentioned or depicted on this site. Such intellectual property remains the property of its respective owners, and any references here are made solely for identification or informational purposes, without implying any affiliation, endorsement, or partnership.
We make no representations or warranties, express or implied, regarding the accuracy, completeness, or suitability of any content or products presented. Nothing on this website should be construed as legal, tax, investment, financial, medical, or other professional advice. In addition, no part of this site—including articles or product references—constitutes a solicitation, recommendation, endorsement, advertisement, or offer to buy or sell any securities, franchises, or other financial instruments, particularly in jurisdictions where such activity would be unlawful.
All content is of a general nature and may not address the specific circumstances of any individual or entity. It is not a substitute for professional advice or services. Any actions you take based on the information provided here are strictly at your own risk. You accept full responsibility for any decisions or outcomes arising from your use of this website and agree to release us from any liability in connection with your use of, or reliance upon, the content or products found herein.