
|
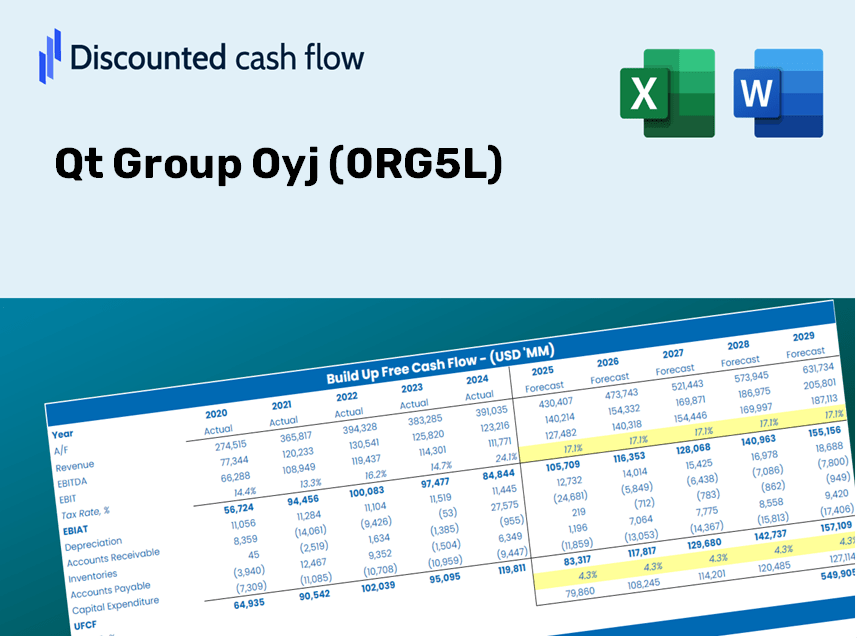
QT GROUP OYJ (0RG5.l) Évaluation DCF |
Entièrement Modifiable: Adapté À Vos Besoins Dans Excel Ou Sheets
Conception Professionnelle: Modèles Fiables Et Conformes Aux Normes Du Secteur
Pré-Construits Pour Une Utilisation Rapide Et Efficace
Compatible MAC/PC, entièrement débloqué
Aucune Expertise N'Est Requise; Facile À Suivre
Qt Group Oyj (0RG5.L) Bundle
Vous cherchez à évaluer la valeur intrinsèque du groupe QT OYJ? Notre calculatrice (0RG5L) DCF intègre des données réelles avec des fonctionnalités de personnalisation approfondies, vous permettant d'affiner vos prévisions et de faire des choix d'investissement plus éclairés.
What You Will Receive
- Authentic QTC Financial Data: Pre-populated with Qt Group Oyj's historical and forecasted data for detailed analysis.
- Completely Customizable Template: Easily adjust critical inputs such as revenue growth, WACC, and EBITDA percentage.
- Instant Calculations: Watch the intrinsic value of Qt Group Oyj update immediately as you make adjustments.
- Expert Valuation Tool: Tailored for investors, analysts, and consultants looking for reliable DCF outcomes.
- Accessible Design: Intuitive layout and clear guidance suitable for users of all skill levels.
Key Features
- Pre-Loaded Data: Qt Group Oyj's historical financial statements and pre-filled forecasts.
- Fully Adjustable Inputs: Modify WACC, tax rates, revenue growth, and EBITDA margins to fit your analysis.
- Instant Results: Watch Qt Group Oyj's intrinsic value update in real time.
- Clear Visual Outputs: Dashboard charts illustrate valuation results and essential metrics.
- Built for Accuracy: A professional-grade tool designed for analysts, investors, and finance professionals.
How It Works
- Step 1: Download the Excel file.
- Step 2: Review the pre-filled data for Qt Group Oyj (0RG5L) (historical and projected).
- Step 3: Modify the key assumptions (yellow cells) according to your analysis.
- Step 4: Observe the automatic recalculations for the intrinsic value of Qt Group Oyj (0RG5L).
- Step 5: Utilize the results for investment decisions or reporting.
Why Opt for This Calculator?
- Designed for Experts: A sophisticated tool favored by analysts, CFOs, and consultants.
- Accurate Financial Data: Historical and projected financials for Qt Group Oyj (0RG5L) preloaded for precision.
- Flexible Scenario Analysis: Effortlessly test various forecasts and assumptions.
- Comprehensive Outputs: Instantly calculates intrinsic value, NPV, and essential metrics.
- User-Friendly: Detailed step-by-step instructions lead you through the process smoothly.
Who Should Utilize This Product?
- Investors: Effectively assess the fair value of Qt Group Oyj (0RG5L) before making investment choices.
- CFOs: Utilize a high-caliber DCF model for financial reporting and analysis related to Qt Group Oyj (0RG5L).
- Consultants: Easily customize the template for valuation reports tailored to clients involving Qt Group Oyj (0RG5L).
- Entrepreneurs: Acquire knowledge of financial modeling techniques employed by leading companies, including Qt Group Oyj (0RG5L).
- Educators: Employ it as a resource to illustrate various valuation methodologies relevant to Qt Group Oyj (0RG5L).
Overview of Template Components
- Historical Data: Comprehensive insights into Qt Group Oyj's past financial performance and baseline forecasts.
- DCF and Levered DCF Models: In-depth templates for assessing the intrinsic value of Qt Group Oyj (0RG5L).
- WACC Sheet: Ready-to-use calculations for the Weighted Average Cost of Capital.
- Editable Inputs: Adjust essential variables such as growth rates, EBITDA %, and CAPEX assumptions.
- Quarterly and Annual Statements: A thorough analysis of Qt Group Oyj's financial statements.
- Interactive Dashboard: Dynamic visualization of valuation results and future projections.
Disclaimer
All information, articles, and product details provided on this website are for general informational and educational purposes only. We do not claim any ownership over, nor do we intend to infringe upon, any trademarks, copyrights, logos, brand names, or other intellectual property mentioned or depicted on this site. Such intellectual property remains the property of its respective owners, and any references here are made solely for identification or informational purposes, without implying any affiliation, endorsement, or partnership.
We make no representations or warranties, express or implied, regarding the accuracy, completeness, or suitability of any content or products presented. Nothing on this website should be construed as legal, tax, investment, financial, medical, or other professional advice. In addition, no part of this site—including articles or product references—constitutes a solicitation, recommendation, endorsement, advertisement, or offer to buy or sell any securities, franchises, or other financial instruments, particularly in jurisdictions where such activity would be unlawful.
All content is of a general nature and may not address the specific circumstances of any individual or entity. It is not a substitute for professional advice or services. Any actions you take based on the information provided here are strictly at your own risk. You accept full responsibility for any decisions or outcomes arising from your use of this website and agree to release us from any liability in connection with your use of, or reliance upon, the content or products found herein.