
|
Kinnevik AB (0RH1.L) Évaluation DCF |
Entièrement Modifiable: Adapté À Vos Besoins Dans Excel Ou Sheets
Conception Professionnelle: Modèles Fiables Et Conformes Aux Normes Du Secteur
Pré-Construits Pour Une Utilisation Rapide Et Efficace
Compatible MAC/PC, entièrement débloqué
Aucune Expertise N'Est Requise; Facile À Suivre
Kinnevik AB (0RH1.L) Bundle
Découvrez la vraie valeur de Kinnevik AB (0RH1L) avec notre calculatrice avancée DCF! Ajustez les hypothèses essentielles, explorez divers scénarios et évaluez comment les changements affectent l'évaluation de Kinnevik AB (0RH1L) - le tout dans un seul modèle Excel.
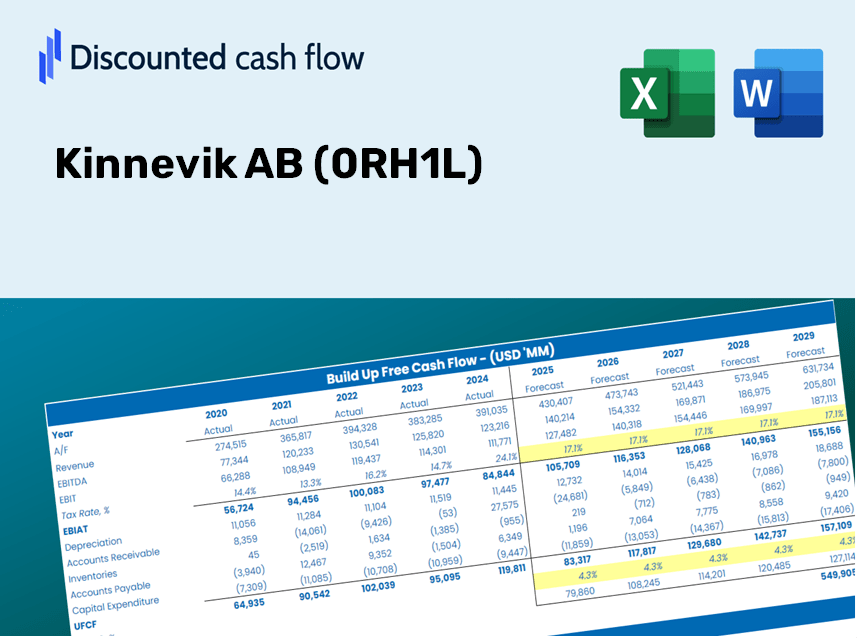
Discounted Cash Flow (DCF) - (USD MM)
| Year | AY1 2020 |
AY2 2021 |
AY3 2022 |
AY4 2023 |
AY5 2024 |
FY1 2025 |
FY2 2026 |
FY3 2027 |
FY4 2028 |
FY5 2029 |
|---|---|---|---|---|---|---|---|---|---|---|
| Revenue | 41,528.0 | 15,115.0 | 3,549.0 | 947.0 | 42.0 | 9.6 | 2.2 | .5 | .1 | .0 |
| Revenue Growth, % | 0 | -63.6 | -76.52 | -73.32 | -95.56 | -77.25 | -77.25 | -77.25 | -77.25 | -77.25 |
| EBITDA | 41,129.0 | 14,661.0 | -19,399.0 | .0 | -2,622.0 | -.1 | .0 | .0 | .0 | .0 |
| EBITDA, % | 99.04 | 97 | -546.6 | 0 | -6242.86 | -0.79289 | -0.79289 | -0.79289 | -0.79289 | -0.79289 |
| Depreciation | .0 | -12,962.0 | 19,679.0 | 5,123.0 | 3,075.0 | 4.1 | .9 | .2 | .0 | .0 |
| Depreciation, % | 0 | -85.76 | 554.49 | 540.97 | 7321.43 | 42.85 | 42.85 | 42.85 | 42.85 | 42.85 |
| EBIT | 41,129.0 | 27,623.0 | -39,078.0 | -5,123.0 | -5,697.0 | -1.9 | -.4 | -.1 | .0 | .0 |
| EBIT, % | 99.04 | 182.75 | -1101.1 | -540.97 | -13564.29 | -20.19 | -20.19 | -20.19 | -20.19 | -20.19 |
| Total Cash | 7,589.0 | 10,544.0 | 13,848.0 | 11,951.0 | 14,619.0 | 7.4 | 1.7 | .4 | .1 | .0 |
| Total Cash, percent | .0 | .0 | .0 | .0 | .0 | .0 | .0 | .0 | .0 | .0 |
| Account Receivables | .0 | .0 | .0 | .0 | .0 | .0 | .0 | .0 | .0 | .0 |
| Account Receivables, % | 0 | 0 | 0 | 0 | 0 | 0 | 0 | 0 | 0 | 0 |
| Inventories | .0 | .0 | .0 | .0 | .0 | .0 | .0 | .0 | .0 | .0 |
| Inventories, % | 0 | 0 | 0 | 0 | 0 | 0 | 0 | 0 | 0 | 0 |
| Accounts Payable | 30.0 | 33.0 | 21.0 | 17.0 | 17.0 | .8 | .2 | .0 | .0 | .0 |
| Accounts Payable, % | 0.07224042 | 0.21833 | 0.59172 | 1.8 | 40.48 | 8.63 | 8.63 | 8.63 | 8.63 | 8.63 |
| Capital Expenditure | .0 | .0 | .0 | .0 | .0 | .0 | .0 | .0 | .0 | .0 |
| Capital Expenditure, % | 0 | 0 | 0 | 0 | 0 | 0 | 0 | 0 | 0 | 0 |
| Tax Rate, % | -0.03813883 | -0.03813883 | -0.03813883 | -0.03813883 | -0.03813883 | -0.03813883 | -0.03813883 | -0.03813883 | -0.03813883 | -0.03813883 |
| EBITAT | 40,296.5 | 27,613.7 | -39,078.0 | -5,123.0 | -5,699.2 | -1.9 | -.4 | -.1 | .0 | .0 |
| Depreciation | ||||||||||
| Changes in Account Receivables | ||||||||||
| Changes in Inventories | ||||||||||
| Changes in Accounts Payable | ||||||||||
| Capital Expenditure | ||||||||||
| UFCF | 40,326.5 | 14,654.7 | -19,411.0 | -4.0 | -2,624.2 | -14.0 | -.1 | .0 | .0 | .0 |
| WACC, % | 9.44 | 9.45 | 9.45 | 9.45 | 9.45 | 9.45 | 9.45 | 9.45 | 9.45 | 9.45 |
| PV UFCF | ||||||||||
| SUM PV UFCF | -12.9 | |||||||||
| Long Term Growth Rate, % | 2.00 | |||||||||
| Free cash flow (T + 1) | 0 | |||||||||
| Terminal Value | 0 | |||||||||
| Present Terminal Value | 0 | |||||||||
| Enterprise Value | -13 | |||||||||
| Net Debt | 346 | |||||||||
| Equity Value | -359 | |||||||||
| Diluted Shares Outstanding, MM | 282 | |||||||||
| Equity Value Per Share | -1.27 |
Benefits of Using Our Model
- Adjustable Forecast Parameters: Effortlessly modify key assumptions (growth %, margins, WACC) to generate various scenarios.
- Comprehensive Data: Kinnevik AB's (0RH1L) financial figures pre-filled to kickstart your analysis.
- Instant DCF Calculations: The model automatically computes Net Present Value (NPV) and intrinsic value for your convenience.
- Tailored and Professional Design: A refined Excel template that caters to your valuation requirements.
- Designed for Analysts and Investors: Perfect for evaluating projections, validating strategies, and enhancing efficiency.
Key Features
- Real-Life Kinnevik AB Data: Pre-filled with Kinnevik’s historical financials and future projections.
- Fully Customizable Inputs: Modify revenue growth rates, profit margins, WACC, tax rates, and capital expenditures.
- Dynamic Valuation Model: Automatic updates to Net Present Value (NPV) and intrinsic value based on your inputs.
- Scenario Testing: Generate multiple forecast scenarios to evaluate various valuation outcomes.
- User-Friendly Design: Intuitive, organized, and crafted for both professionals and novices.
How It Works
- Step 1: Download the Excel file for Kinnevik AB (0RH1L).
- Step 2: Review the pre-filled financial data and forecasts for Kinnevik AB (0RH1L).
- Step 3: Adjust key inputs such as revenue growth, WACC, and tax rates (highlighted cells) for Kinnevik AB (0RH1L).
- Step 4: Observe the DCF model update in real-time as you change assumptions for Kinnevik AB (0RH1L).
- Step 5: Evaluate the outputs and leverage the results for your investment decisions regarding Kinnevik AB (0RH1L).
Why Opt for This Kinnevik AB Calculator?
- All-in-One Solution: Features DCF, WACC, and financial ratio analyses seamlessly integrated.
- Flexible Inputs: Modify the highlighted cells to explore different financial scenarios.
- In-Depth Analysis: Automatically computes Kinnevik AB’s intrinsic value and Net Present Value.
- Preloaded Information: Access historical and projected data for reliable starting points.
- High-Quality Standards: Perfect for financial analysts, investors, and business consultants alike.
Who Can Benefit from This Product?
- Investors: Evaluate Kinnevik AB’s (0RH1L) intrinsic value for informed investment choices.
- CFOs: Utilize a sophisticated DCF model for precise financial reporting and analysis.
- Consultants: Effortlessly modify the template for client valuation reports.
- Entrepreneurs: Acquire knowledge of financial modeling practices employed by industry leaders.
- Educators: Employ it as a resource to illustrate various valuation techniques.
Contents of the Template
- Pre-Filled Data: Contains Kinnevik AB’s historical financial data and projections.
- Discounted Cash Flow Model: An editable DCF valuation model featuring automatic calculations.
- Weighted Average Cost of Capital (WACC): A specific worksheet for computing WACC based on your custom inputs.
- Key Financial Ratios: Evaluate Kinnevik AB’s profitability, operational efficiency, and financial leverage.
- Customizable Inputs: Easily modify revenue growth rates, profit margins, and tax rates.
- Clear Dashboard: Visualizations and tables that summarize essential valuation outcomes.
Disclaimer
All information, articles, and product details provided on this website are for general informational and educational purposes only. We do not claim any ownership over, nor do we intend to infringe upon, any trademarks, copyrights, logos, brand names, or other intellectual property mentioned or depicted on this site. Such intellectual property remains the property of its respective owners, and any references here are made solely for identification or informational purposes, without implying any affiliation, endorsement, or partnership.
We make no representations or warranties, express or implied, regarding the accuracy, completeness, or suitability of any content or products presented. Nothing on this website should be construed as legal, tax, investment, financial, medical, or other professional advice. In addition, no part of this site—including articles or product references—constitutes a solicitation, recommendation, endorsement, advertisement, or offer to buy or sell any securities, franchises, or other financial instruments, particularly in jurisdictions where such activity would be unlawful.
All content is of a general nature and may not address the specific circumstances of any individual or entity. It is not a substitute for professional advice or services. Any actions you take based on the information provided here are strictly at your own risk. You accept full responsibility for any decisions or outcomes arising from your use of this website and agree to release us from any liability in connection with your use of, or reliance upon, the content or products found herein.