
|
BONESUPPort Holding AB (0RQO.L) Évaluation DCF |
Entièrement Modifiable: Adapté À Vos Besoins Dans Excel Ou Sheets
Conception Professionnelle: Modèles Fiables Et Conformes Aux Normes Du Secteur
Pré-Construits Pour Une Utilisation Rapide Et Efficace
Compatible MAC/PC, entièrement débloqué
Aucune Expertise N'Est Requise; Facile À Suivre
Bonesupport Holding AB (publ) (0RQO.L) Bundle
Conçu pour la précision, notre calculatrice (0RQOL) DCF vous permet d'évaluer l'évaluation de la maintenance AB (publication) à l'aide de données financières du monde réel et offre une flexibilité complète pour modifier tous les paramètres clés pour des projections améliorées.
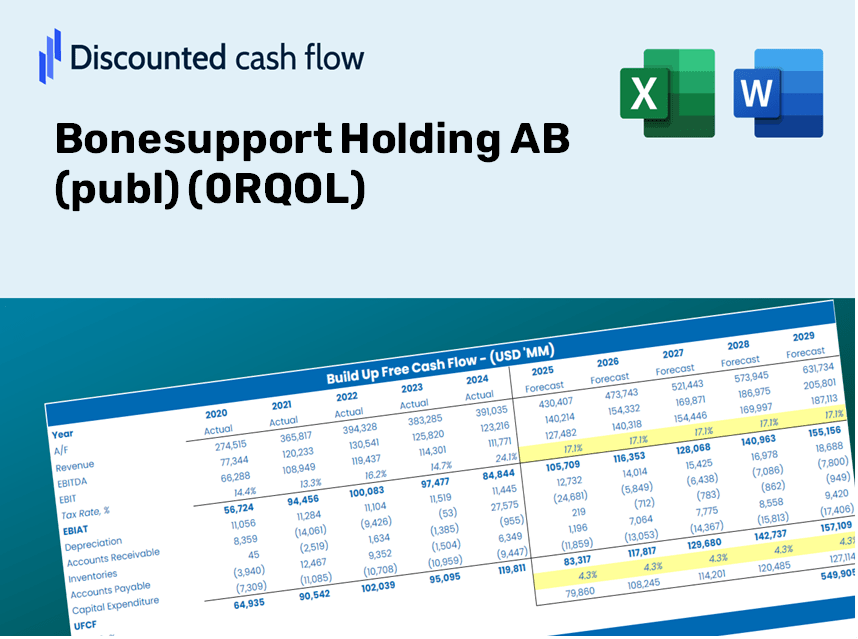
Discounted Cash Flow (DCF) - (USD MM)
| Year | AY1 2020 |
AY2 2021 |
AY3 2022 |
AY4 2023 |
AY5 2024 |
FY1 2025 |
FY2 2026 |
FY3 2027 |
FY4 2028 |
FY5 2029 |
|---|---|---|---|---|---|---|---|---|---|---|
| Revenue | 180.9 | 212.9 | 328.8 | 591.1 | 898.7 | 1,357.0 | 2,049.0 | 3,093.8 | 4,671.5 | 7,053.6 |
| Revenue Growth, % | 0 | 17.71 | 54.46 | 79.76 | 52.05 | 50.99 | 50.99 | 50.99 | 50.99 | 50.99 |
| EBITDA | -90.9 | -72.4 | -54.3 | 28.9 | 185.8 | -204.2 | -308.3 | -465.5 | -702.9 | -1,061.4 |
| EBITDA, % | -50.27 | -34.01 | -16.53 | 4.9 | 20.67 | -15.05 | -15.05 | -15.05 | -15.05 | -15.05 |
| Depreciation | 7.6 | 8.3 | 9.4 | 10.1 | 10.8 | 37.7 | 56.9 | 85.9 | 129.6 | 195.7 |
| Depreciation, % | 4.23 | 3.89 | 2.85 | 1.7 | 1.21 | 2.78 | 2.78 | 2.78 | 2.78 | 2.78 |
| EBIT | -98.6 | -80.7 | -63.7 | 18.9 | 174.9 | -241.9 | -365.2 | -551.4 | -832.6 | -1,257.1 |
| EBIT, % | -54.49 | -37.89 | -19.38 | 3.19 | 19.46 | -17.82 | -17.82 | -17.82 | -17.82 | -17.82 |
| Total Cash | 353.7 | 206.5 | 201.3 | 167.4 | 227.0 | 846.1 | 1,277.6 | 1,929.1 | 2,912.9 | 4,398.2 |
| Total Cash, percent | .0 | .0 | .0 | .0 | .0 | .0 | .0 | .0 | .0 | .0 |
| Account Receivables | 38.7 | 41.5 | 65.7 | 116.6 | 240.7 | 291.5 | 440.2 | 664.7 | 1,003.6 | 1,515.4 |
| Account Receivables, % | 21.41 | 19.51 | 19.99 | 19.72 | 26.79 | 21.48 | 21.48 | 21.48 | 21.48 | 21.48 |
| Inventories | 45.6 | 51.8 | 56.3 | 83.3 | 134.1 | 259.6 | 391.9 | 591.8 | 893.6 | 1,349.3 |
| Inventories, % | 25.19 | 24.31 | 17.12 | 14.09 | 14.92 | 19.13 | 19.13 | 19.13 | 19.13 | 19.13 |
| Accounts Payable | 12.7 | 18.7 | 23.6 | 19.7 | 17.8 | 76.8 | 115.9 | 175.0 | 264.3 | 399.0 |
| Accounts Payable, % | 7.01 | 8.79 | 7.17 | 3.33 | 1.98 | 5.66 | 5.66 | 5.66 | 5.66 | 5.66 |
| Capital Expenditure | -2.7 | -3.4 | -3.3 | -6.1 | -5.8 | -15.6 | -23.5 | -35.6 | -53.7 | -81.1 |
| Capital Expenditure, % | -1.47 | -1.6 | -0.99721 | -1.03 | -0.64981 | -1.15 | -1.15 | -1.15 | -1.15 | -1.15 |
| Tax Rate, % | 22.52 | 22.52 | 22.52 | 22.52 | 22.52 | 22.52 | 22.52 | 22.52 | 22.52 | 22.52 |
| EBITAT | -101.0 | -84.3 | -67.1 | 293.5 | 135.5 | -231.0 | -348.7 | -526.6 | -795.1 | -1,200.5 |
| Depreciation | ||||||||||
| Changes in Account Receivables | ||||||||||
| Changes in Inventories | ||||||||||
| Changes in Accounts Payable | ||||||||||
| Capital Expenditure | ||||||||||
| UFCF | -167.6 | -82.4 | -85.0 | 215.8 | -36.3 | -326.2 | -557.3 | -841.5 | -1,270.6 | -1,918.5 |
| WACC, % | 6.95 | 6.95 | 6.95 | 6.95 | 6.95 | 6.95 | 6.95 | 6.95 | 6.95 | 6.95 |
| PV UFCF | ||||||||||
| SUM PV UFCF | -3,821.8 | |||||||||
| Long Term Growth Rate, % | 2.00 | |||||||||
| Free cash flow (T + 1) | -1,957 | |||||||||
| Terminal Value | -39,499 | |||||||||
| Present Terminal Value | -28,222 | |||||||||
| Enterprise Value | -32,044 | |||||||||
| Net Debt | -212 | |||||||||
| Equity Value | -31,832 | |||||||||
| Diluted Shares Outstanding, MM | 67 | |||||||||
| Equity Value Per Share | -477.90 |
What You'll Receive
- Accurate BONES Financials: Contains both historical and projected data for precise valuation.
- Customizable Inputs: Adjust WACC, tax rates, revenue growth, and capital expenditures as needed.
- Dynamic Calculations: Automatically computes intrinsic value and NPV in real-time.
- Scenario Testing: Evaluate various scenarios to forecast BONESUPPORT's future performance.
- User-Friendly Design: Designed for industry professionals, while remaining approachable for new users.
Key Features
- 🔍 Real-Life BONE Financials: Pre-filled historical and projected data for Bonesupport Holding AB (publ) (0RQOL).
- ✏️ Fully Customizable Inputs: Adjust all critical parameters (yellow cells) such as WACC, growth %, and tax rates.
- 📊 Professional DCF Valuation: Built-in formulas calculate Bonesupport's intrinsic value using the Discounted Cash Flow method.
- ⚡ Instant Results: Visualize Bonesupport's valuation immediately after making adjustments.
- Scenario Analysis: Test and compare outcomes for various financial assumptions side-by-side.
How It Works
- Step 1: Download the prebuilt Excel template featuring Bonesupport Holding AB (publ) data.
- Step 2: Navigate through the pre-filled sheets to familiarize yourself with the essential metrics.
- Step 3: Modify forecasts and assumptions in the editable yellow cells (WACC, growth, margins).
- Step 4: Instantly see the recalculated results, including the intrinsic value of Bonesupport Holding AB (publ).
- Step 5: Use the outputs to make informed investment decisions or create comprehensive reports.
Why Choose the Bonesupport Holding AB (publ) (0RQOL) Calculator?
- Precision: Utilizes verified Bonesupport financial data for reliable results.
- Adaptability: Tailored for users to effortlessly test and adjust parameters.
- Efficiency: Eliminate the complexity of constructing financial models from the ground up.
- Professional Quality: Crafted with the accuracy and usability expected at the CFO level.
- Intuitive Interface: Designed for ease of use, even for individuals with limited financial modeling knowledge.
Who Can Benefit from This Product?
- Professional Investors: Create comprehensive and accurate valuation models for effective portfolio evaluation.
- Corporate Finance Teams: Explore valuation scenarios to inform strategic decisions within the company.
- Consultants and Advisors: Deliver precise valuation analyses to clients investing in Bonesupport Holding AB (0RQOL).
- Students and Educators: Utilize real-world data for hands-on learning and teaching in financial modeling.
- Healthcare Sector Enthusiasts: Gain insights into how companies like Bonesupport Holding AB (0RQOL) are assessed in the market.
Contents of the Template
- Pre-Filled Data: Features historical financials and projections for Bonesupport Holding AB (publ) [0RQOL].
- Discounted Cash Flow Model: An editable DCF valuation model with automatic calculations for streamlined analysis.
- Weighted Average Cost of Capital (WACC): A dedicated sheet for calculating WACC using custom inputs tailored to the company.
- Key Financial Ratios: Assess Bonesupport Holding AB's (publ) [0RQOL] profitability, operational efficiency, and financial leverage.
- Customizable Inputs: Easily modify revenue growth, profit margins, and tax rates.
- Clear Dashboard: Visuals and tables that provide a concise summary of critical valuation outcomes.
Disclaimer
All information, articles, and product details provided on this website are for general informational and educational purposes only. We do not claim any ownership over, nor do we intend to infringe upon, any trademarks, copyrights, logos, brand names, or other intellectual property mentioned or depicted on this site. Such intellectual property remains the property of its respective owners, and any references here are made solely for identification or informational purposes, without implying any affiliation, endorsement, or partnership.
We make no representations or warranties, express or implied, regarding the accuracy, completeness, or suitability of any content or products presented. Nothing on this website should be construed as legal, tax, investment, financial, medical, or other professional advice. In addition, no part of this site—including articles or product references—constitutes a solicitation, recommendation, endorsement, advertisement, or offer to buy or sell any securities, franchises, or other financial instruments, particularly in jurisdictions where such activity would be unlawful.
All content is of a general nature and may not address the specific circumstances of any individual or entity. It is not a substitute for professional advice or services. Any actions you take based on the information provided here are strictly at your own risk. You accept full responsibility for any decisions or outcomes arising from your use of this website and agree to release us from any liability in connection with your use of, or reliance upon, the content or products found herein.