
|
Groupe DWS GmbH & Co. KGAA (0SAY.L) Évaluation DCF |
Entièrement Modifiable: Adapté À Vos Besoins Dans Excel Ou Sheets
Conception Professionnelle: Modèles Fiables Et Conformes Aux Normes Du Secteur
Pré-Construits Pour Une Utilisation Rapide Et Efficace
Compatible MAC/PC, entièrement débloqué
Aucune Expertise N'Est Requise; Facile À Suivre
DWS Group GmbH & Co. KGaA (0SAY.L) Bundle
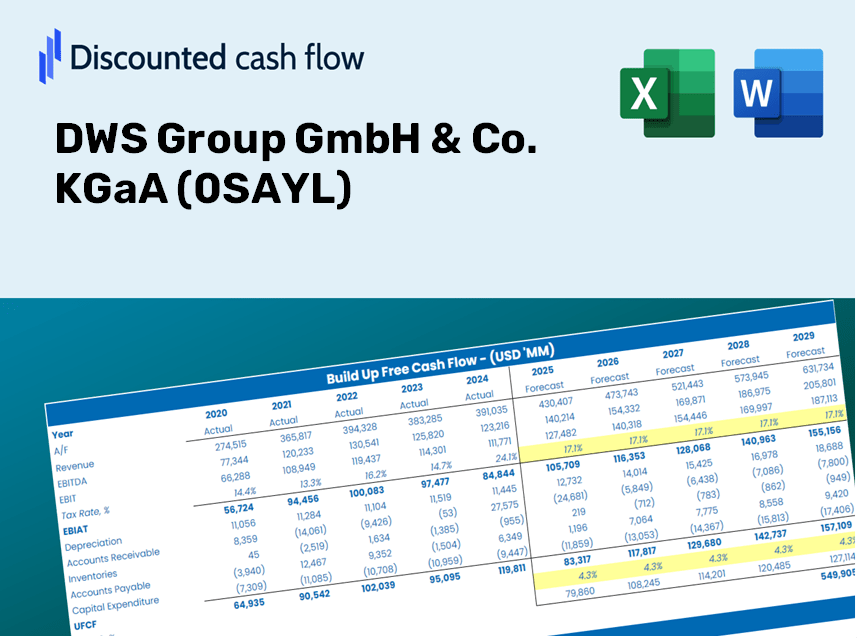
Simplifier le groupe DWS GmbH & Co. KGAA Valation avec cette calculatrice DCF personnalisable! Avec le vrai groupe DWS GmbH & Co. KGAA Financials and Adjustable Prévisions Entrées, vous pouvez tester des scénarios et découvrir le groupe DWS GmbH & Co. KGAA FAIL VALUE EN MINUTÉ.
What You Will Receive
- Comprehensive Financial Model: Leverage DWS Group's actual data for accurate DCF valuation.
- Complete Forecasting Flexibility: Adjust key parameters like revenue growth, profit margins, WACC, and more.
- Real-Time Calculations: Automatic updates provide immediate insights as you modify inputs.
- Investor-Ready Template: A polished Excel file crafted for high-standard valuation needs.
- Customizable and Reusable: Designed for adaptability, allowing for repeated application in detailed forecasting.
Key Features
- Pre-Loaded Data: DWS Group’s historical financial statements and pre-filled projections.
- Fully Adjustable Inputs: Customize WACC, tax rates, revenue growth, and EBITDA margins.
- Instant Results: View DWS Group’s intrinsic value recalculating in real time.
- Clear Visual Outputs: Dashboard charts illustrate valuation results and key metrics.
- Built for Accuracy: A professional tool designed for analysts, investors, and finance experts.
How It Works
- Download: Obtain the pre-built Excel file containing DWS Group GmbH & Co. KGaA’s (0SAYL) financial data.
- Customize: Modify forecasts, including revenue growth, EBITDA %, and WACC as per your analysis.
- Update Automatically: Experience real-time updates for the intrinsic value and NPV calculations.
- Test Scenarios: Generate various projections and swiftly compare the results.
- Make Decisions: Leverage the valuation outcomes to inform your investment approach.
Why Choose the DWS Group GmbH & Co. KGaA Calculator?
- Time-Saving: Skip the hassle of building a DCF model from the ground up – it's ready to go.
- Enhanced Accuracy: Dependable financial data and calculations minimize valuation errors.
- Completely Customizable: Adjust the model to align with your specific assumptions and forecasts.
- User-Friendly: Intuitive charts and outputs simplify the analysis of results.
- Favored by Professionals: Crafted for experts who prioritize accuracy and functionality.
Who Can Benefit from DWS Group GmbH & Co. KGaA (0SAYL)?
- Investors: Gain the confidence to make informed choices with our top-tier valuation tool.
- Financial Analysts: Enhance efficiency with our ready-to-customize DCF model.
- Consultants: Seamlessly modify templates for impactful client presentations and reports.
- Finance Enthusiasts: Expand your knowledge of valuation practices through real-world scenarios.
- Educators and Students: Utilize this resource as a hands-on learning aid in finance classes.
What the Template Includes
- Historical Data: Contains DWS Group's previous financial performance and foundational forecasts.
- DCF and Levered DCF Models: Comprehensive templates for assessing DWS Group's intrinsic value.
- WACC Sheet: Ready-to-use calculations for the Weighted Average Cost of Capital.
- Editable Inputs: Customize essential parameters such as growth rates, EBITDA percentages, and CAPEX projections.
- Quarterly and Annual Statements: An extensive overview of DWS Group's financials.
- Interactive Dashboard: Dynamically visualize valuation outcomes and forecasts.
Disclaimer
All information, articles, and product details provided on this website are for general informational and educational purposes only. We do not claim any ownership over, nor do we intend to infringe upon, any trademarks, copyrights, logos, brand names, or other intellectual property mentioned or depicted on this site. Such intellectual property remains the property of its respective owners, and any references here are made solely for identification or informational purposes, without implying any affiliation, endorsement, or partnership.
We make no representations or warranties, express or implied, regarding the accuracy, completeness, or suitability of any content or products presented. Nothing on this website should be construed as legal, tax, investment, financial, medical, or other professional advice. In addition, no part of this site—including articles or product references—constitutes a solicitation, recommendation, endorsement, advertisement, or offer to buy or sell any securities, franchises, or other financial instruments, particularly in jurisdictions where such activity would be unlawful.
All content is of a general nature and may not address the specific circumstances of any individual or entity. It is not a substitute for professional advice or services. Any actions you take based on the information provided here are strictly at your own risk. You accept full responsibility for any decisions or outcomes arising from your use of this website and agree to release us from any liability in connection with your use of, or reliance upon, the content or products found herein.