
|
FormyCon AG (0w4n.l) Évaluation DCF |
Entièrement Modifiable: Adapté À Vos Besoins Dans Excel Ou Sheets
Conception Professionnelle: Modèles Fiables Et Conformes Aux Normes Du Secteur
Pré-Construits Pour Une Utilisation Rapide Et Efficace
Compatible MAC/PC, entièrement débloqué
Aucune Expertise N'Est Requise; Facile À Suivre
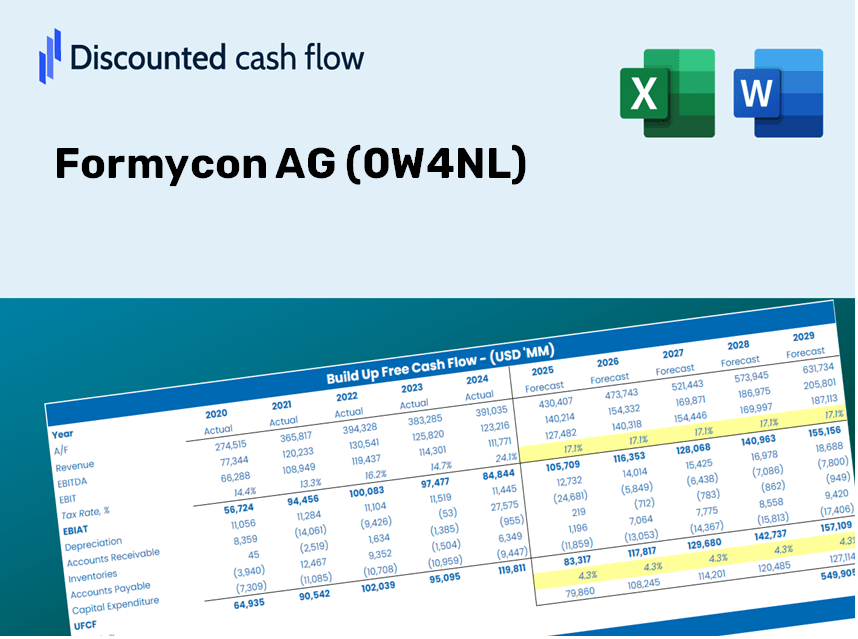
Formycon AG (0W4N.L) Bundle
Simplifiez l'évaluation du formycon AG avec cette calculatrice DCF personnalisable! Doté de véritables aliments financiers AG et de prévisions réglables, vous pouvez tester des scénarios et découvrir la juste valeur de Formycon AG en quelques minutes.
Discounted Cash Flow (DCF) - (USD MM)
| Year | AY1 2020 |
AY2 2021 |
AY3 2022 |
AY4 2023 |
AY5 2024 |
FY1 2025 |
FY2 2026 |
FY3 2027 |
FY4 2028 |
FY5 2029 |
|---|---|---|---|---|---|---|---|---|---|---|
| Revenue | 34.2 | 36.6 | 42.5 | 77.7 | 69.7 | 86.3 | 106.9 | 132.5 | 164.1 | 203.3 |
| Revenue Growth, % | 0 | 6.97 | 16.07 | 82.83 | -10.32 | 23.89 | 23.89 | 23.89 | 23.89 | 23.89 |
| EBITDA | -5.6 | -12.4 | 51.5 | 81.1 | -4.1 | 24.8 | 30.7 | 38.1 | 47.2 | 58.5 |
| EBITDA, % | -16.44 | -33.93 | 121.26 | 104.32 | -5.88 | 28.75 | 28.75 | 28.75 | 28.75 | 28.75 |
| Depreciation | .9 | 1.6 | 1.9 | 1.9 | 139.1 | 19.7 | 24.4 | 30.2 | 37.4 | 46.3 |
| Depreciation, % | 2.67 | 4.4 | 4.38 | 2.43 | 199.59 | 22.78 | 22.78 | 22.78 | 22.78 | 22.78 |
| EBIT | -6.5 | -14.0 | 49.7 | 79.2 | -143.2 | 7.3 | 9.1 | 11.3 | 14.0 | 17.3 |
| EBIT, % | -19.11 | -38.33 | 116.88 | 101.89 | -205.48 | 8.51 | 8.51 | 8.51 | 8.51 | 8.51 |
| Total Cash | 42.2 | 25.2 | 9.8 | 27.0 | 41.8 | 49.5 | 61.3 | 76.0 | 94.1 | 116.6 |
| Total Cash, percent | .0 | .0 | .0 | .0 | .0 | .0 | .0 | .0 | .0 | .0 |
| Account Receivables | 6.9 | 11.9 | 15.5 | 28.3 | 30.7 | 29.3 | 36.3 | 45.0 | 55.7 | 69.0 |
| Account Receivables, % | 20.14 | 32.61 | 36.41 | 36.43 | 44.08 | 33.93 | 33.93 | 33.93 | 33.93 | 33.93 |
| Inventories | 1.2 | .2 | .6 | .5 | .3 | 1.1 | 1.4 | 1.7 | 2.1 | 2.6 |
| Inventories, % | 3.61 | 0.57084 | 1.34 | 0.60106 | 0.37604 | 1.3 | 1.3 | 1.3 | 1.3 | 1.3 |
| Accounts Payable | 4.5 | 7.6 | 11.3 | 16.3 | 17.4 | 18.4 | 22.8 | 28.2 | 35.0 | 43.3 |
| Accounts Payable, % | 13.1 | 20.77 | 26.63 | 21 | 25.03 | 21.31 | 21.31 | 21.31 | 21.31 | 21.31 |
| Capital Expenditure | -.7 | -.9 | -26.8 | -1.0 | -29.9 | -19.3 | -23.9 | -29.6 | -36.7 | -45.4 |
| Capital Expenditure, % | -1.9 | -2.57 | -62.97 | -1.32 | -42.97 | -22.35 | -22.35 | -22.35 | -22.35 | -22.35 |
| Tax Rate, % | 12.88 | 12.88 | 12.88 | 12.88 | 12.88 | 12.88 | 12.88 | 12.88 | 12.88 | 12.88 |
| EBITAT | -6.6 | -13.1 | 48.9 | 75.9 | -124.7 | 7.0 | 8.6 | 10.7 | 13.3 | 16.4 |
| Depreciation | ||||||||||
| Changes in Account Receivables | ||||||||||
| Changes in Inventories | ||||||||||
| Changes in Accounts Payable | ||||||||||
| Capital Expenditure | ||||||||||
| UFCF | -10.0 | -13.4 | 23.8 | 69.0 | -16.7 | 8.9 | 6.2 | 7.7 | 9.6 | 11.9 |
| WACC, % | 7.61 | 7.59 | 7.6 | 7.59 | 7.57 | 7.59 | 7.59 | 7.59 | 7.59 | 7.59 |
| PV UFCF | ||||||||||
| SUM PV UFCF | 35.2 | |||||||||
| Long Term Growth Rate, % | 2.00 | |||||||||
| Free cash flow (T + 1) | 12 | |||||||||
| Terminal Value | 216 | |||||||||
| Present Terminal Value | 150 | |||||||||
| Enterprise Value | 185 | |||||||||
| Net Debt | -31 | |||||||||
| Equity Value | 216 | |||||||||
| Diluted Shares Outstanding, MM | 17 | |||||||||
| Equity Value Per Share | 12.37 |
What You Will Receive
- Pre-Populated Financial Model: Formycon AG's (0W4NL) actual data enables accurate DCF valuation.
- Comprehensive Forecast Control: Modify revenue growth, profit margins, WACC, and other essential variables.
- Immediate Calculations: Real-time updates let you view results as adjustments are made.
- Professional-Grade Template: A polished Excel file crafted for high-quality valuation analysis.
- Customizable and Reusable: Designed for adaptability, suitable for repeated use in detailed forecasting.
Key Highlights
- Customizable Forecast Inputs: Adjust essential factors such as revenue growth, EBITDA percentage, and capital expenditures.
- Instant DCF Valuation: Quickly computes intrinsic value, NPV, and additional metrics.
- High-Precision Accuracy: Utilizes Formycon AG's (0W4NL) real-world financial data for realistic valuation results.
- Effortless Scenario Analysis: Easily test various assumptions and evaluate results side by side.
- Efficiency Booster: Remove the need to create intricate valuation models from the ground up.
How It Works
- Step 1: Download the Excel file.
- Step 2: Examine Formycon AG’s (0W4NL) pre-filled financial data and projections.
- Step 3: Adjust key inputs such as revenue growth, WACC, and tax rates (highlighted cells).
- Step 4: Observe the DCF model refresh in real-time as you modify the assumptions.
- Step 5: Evaluate the outputs to inform your investment decisions.
Why Opt for the Formycon AG Calculator?
- Precision: Leverages authentic Formycon AG financial data to ensure reliability.
- Customizability: Tailored for users to easily adjust and experiment with inputs.
- Efficiency: Eliminate the need to construct a DCF model from the ground up.
- Expert Quality: Crafted with the precision and functionality preferred by CFOs.
- Intuitive Interface: Simple to navigate, suitable for users without extensive financial modeling skills.
Who Should Consider Using Formycon AG (0W4NL)?
- Investors: Evaluate Formycon AG’s valuation to make informed buying or selling decisions.
- CFOs and Financial Analysts: Enhance valuation methodologies and assess future projections.
- Startup Founders: Gain insights into how established companies like Formycon AG are valued.
- Consultants: Provide clients with detailed and professional valuation reports.
- Students and Educators: Utilize authentic data to practice and instruct on valuation strategies.
Contents of the Template
- Pre-Filled Data: Contains Formycon AG’s historical financial performance and projections.
- Discounted Cash Flow Model: An editable DCF valuation model equipped with automatic calculations.
- Weighted Average Cost of Capital (WACC): A separate sheet designed for calculating WACC using custom inputs.
- Key Financial Ratios: Evaluate Formycon AG’s profitability, efficiency, and financial leverage.
- Customizable Inputs: Easily modify revenue growth, margins, and tax rates.
- Clear Dashboard: Visual charts and tables summarizing essential valuation outcomes.
Disclaimer
All information, articles, and product details provided on this website are for general informational and educational purposes only. We do not claim any ownership over, nor do we intend to infringe upon, any trademarks, copyrights, logos, brand names, or other intellectual property mentioned or depicted on this site. Such intellectual property remains the property of its respective owners, and any references here are made solely for identification or informational purposes, without implying any affiliation, endorsement, or partnership.
We make no representations or warranties, express or implied, regarding the accuracy, completeness, or suitability of any content or products presented. Nothing on this website should be construed as legal, tax, investment, financial, medical, or other professional advice. In addition, no part of this site—including articles or product references—constitutes a solicitation, recommendation, endorsement, advertisement, or offer to buy or sell any securities, franchises, or other financial instruments, particularly in jurisdictions where such activity would be unlawful.
All content is of a general nature and may not address the specific circumstances of any individual or entity. It is not a substitute for professional advice or services. Any actions you take based on the information provided here are strictly at your own risk. You accept full responsibility for any decisions or outcomes arising from your use of this website and agree to release us from any liability in connection with your use of, or reliance upon, the content or products found herein.