
|
China Shenhua Energy Company Limited (1088.hk) Évaluation DCF |
Entièrement Modifiable: Adapté À Vos Besoins Dans Excel Ou Sheets
Conception Professionnelle: Modèles Fiables Et Conformes Aux Normes Du Secteur
Pré-Construits Pour Une Utilisation Rapide Et Efficace
Compatible MAC/PC, entièrement débloqué
Aucune Expertise N'Est Requise; Facile À Suivre
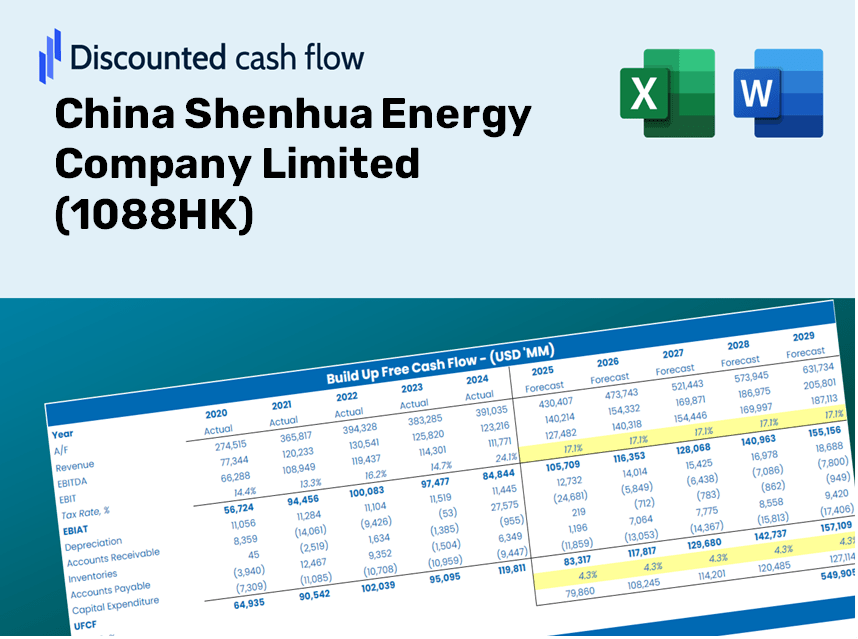
China Shenhua Energy Company Limited (1088.HK) Bundle
Évaluez les perspectives financières de China Shenhua Energy Company Limited comme un expert! Cette calculatrice DCF (1088HK) est livrée avec des données financières pré-remplies et offre une pleine flexibilité pour modifier la croissance des revenus, le WACC, les marges et d'autres hypothèses cruciales pour s'aligner sur vos prévisions.
Discounted Cash Flow (DCF) - (USD MM)
| Year | AY1 2020 |
AY2 2021 |
AY3 2022 |
AY4 2023 |
AY5 2024 |
FY1 2025 |
FY2 2026 |
FY3 2027 |
FY4 2028 |
FY5 2029 |
|---|---|---|---|---|---|---|---|---|---|---|
| Revenue | 254,598.3 | 365,876.4 | 376,045.6 | 374,453.2 | 369,324.4 | 410,590.4 | 456,467.3 | 507,470.2 | 564,171.9 | 627,209.0 |
| Revenue Growth, % | 0 | 43.71 | 2.78 | -0.42347 | -1.37 | 11.17 | 11.17 | 11.17 | 11.17 | 11.17 |
| EBITDA | 88,393.4 | 104,723.9 | 132,094.5 | 118,947.8 | 121,409.1 | 133,941.0 | 148,906.7 | 165,544.7 | 184,041.6 | 204,605.3 |
| EBITDA, % | 34.72 | 28.62 | 35.13 | 31.77 | 32.87 | 32.62 | 32.62 | 32.62 | 32.62 | 32.62 |
| Depreciation | 20,616.7 | 21,413.4 | 23,561.4 | 24,097.4 | 24,849.4 | 27,410.7 | 30,473.4 | 33,878.3 | 37,663.7 | 41,872.0 |
| Depreciation, % | 8.1 | 5.85 | 6.27 | 6.44 | 6.73 | 6.68 | 6.68 | 6.68 | 6.68 | 6.68 |
| EBIT | 67,776.7 | 83,310.4 | 108,533.1 | 94,850.5 | 96,559.7 | 106,530.3 | 118,433.3 | 131,666.3 | 146,377.9 | 162,733.3 |
| EBIT, % | 26.62 | 22.77 | 28.86 | 25.33 | 26.14 | 25.95 | 25.95 | 25.95 | 25.95 | 25.95 |
| Total Cash | 139,114.8 | 177,784.3 | 186,098.0 | 164,030.8 | 174,325.5 | 200,144.0 | 222,506.8 | 247,368.4 | 275,007.8 | 305,735.5 |
| Total Cash, percent | .0 | .0 | .0 | .0 | .0 | .0 | .0 | .0 | .0 | .0 |
| Account Receivables | 12,834.5 | 14,851.6 | 13,754.6 | 21,951.5 | 20,796.8 | 19,914.7 | 22,139.8 | 24,613.6 | 27,363.8 | 30,421.3 |
| Account Receivables, % | 5.04 | 4.06 | 3.66 | 5.86 | 5.63 | 4.85 | 4.85 | 4.85 | 4.85 | 4.85 |
| Inventories | 13,916.2 | 13,788.5 | 13,202.4 | 14,021.0 | 13,623.7 | 16,570.3 | 18,421.7 | 20,480.1 | 22,768.4 | 25,312.4 |
| Inventories, % | 5.47 | 3.77 | 3.51 | 3.74 | 3.69 | 4.04 | 4.04 | 4.04 | 4.04 | 4.04 |
| Accounts Payable | 31,630.6 | 38,437.0 | 26,281.4 | 25,265.2 | 41,699.4 | 39,380.6 | 43,780.7 | 48,672.5 | 54,110.9 | 60,156.9 |
| Accounts Payable, % | 12.42 | 10.51 | 6.99 | 6.75 | 11.29 | 9.59 | 9.59 | 9.59 | 9.59 | 9.59 |
| Capital Expenditure | -22,563.9 | -26,045.6 | -31,307.6 | -40,475.9 | -40,419.1 | -37,823.7 | -42,049.9 | -46,748.3 | -51,971.6 | -57,778.6 |
| Capital Expenditure, % | -8.86 | -7.12 | -8.33 | -10.81 | -10.94 | -9.21 | -9.21 | -9.21 | -9.21 | -9.21 |
| Tax Rate, % | 31.61 | 31.61 | 31.61 | 31.61 | 31.61 | 31.61 | 31.61 | 31.61 | 31.61 | 31.61 |
| EBITAT | 42,367.2 | 53,925.9 | 78,538.7 | 64,949.1 | 66,034.0 | 71,687.3 | 79,697.3 | 88,602.1 | 98,502.0 | 109,508.0 |
| Depreciation | ||||||||||
| Changes in Account Receivables | ||||||||||
| Changes in Inventories | ||||||||||
| Changes in Accounts Payable | ||||||||||
| Capital Expenditure | ||||||||||
| UFCF | 45,300.0 | 54,210.8 | 60,319.9 | 38,538.9 | 68,450.5 | 56,891.1 | 68,444.4 | 76,091.9 | 84,594.0 | 94,046.0 |
| WACC, % | 5.83 | 5.84 | 5.86 | 5.85 | 5.85 | 5.84 | 5.84 | 5.84 | 5.84 | 5.84 |
| PV UFCF | ||||||||||
| SUM PV UFCF | 317,208.7 | |||||||||
| Long Term Growth Rate, % | 2.00 | |||||||||
| Free cash flow (T + 1) | 95,927 | |||||||||
| Terminal Value | 2,495,111 | |||||||||
| Present Terminal Value | 1,878,220 | |||||||||
| Enterprise Value | 2,195,429 | |||||||||
| Net Debt | -121,611 | |||||||||
| Equity Value | 2,317,040 | |||||||||
| Diluted Shares Outstanding, MM | 19,869 | |||||||||
| Equity Value Per Share | 116.62 |
What You Will Receive
- Customizable Excel Template: A fully adaptable Excel-based DCF Calculator featuring pre-loaded financial data for China Shenhua Energy Company Limited (1088HK).
- Up-to-Date Data: Access to historical figures and future projections (highlighted in the yellow cells).
- Adjustable Forecasts: Modify key assumptions such as revenue growth, EBITDA margin, and WACC.
- Instant Calculations: Quickly assess how your inputs affect the valuation of China Shenhua Energy Company Limited (1088HK).
- Professional Resource: Designed for use by investors, CFOs, consultants, and financial analysts.
- Intuitive Layout: Organized for ease of understanding and usability, complete with detailed instructions.
Key Features
- Real-Time CHINA SHENHUA Data: Pre-filled with historical financial performance and future growth projections for China Shenhua Energy Company Limited (1088HK).
- Comprehensive Customization Options: Modify inputs such as revenue growth, profit margins, weighted average cost of capital (WACC), tax rates, and capital expenditures.
- Adaptive Valuation Model: Automatically refreshes Net Present Value (NPV) and intrinsic value based on your specified parameters.
- Scenario Analysis: Develop various forecasting scenarios to evaluate different valuation results.
- Intuitive Interface: Well-organized and designed for both professionals and newcomers to easily navigate.
How It Works
- Step 1: Download the Excel file.
- Step 2: Review the pre-filled data for China Shenhua Energy Company Limited (1088HK) (historical and projected).
- Step 3: Modify the key assumptions (yellow cells) according to your analysis.
- Step 4: Observe the automatic recalculations for the intrinsic value of China Shenhua Energy Company Limited (1088HK).
- Step 5: Utilize the outputs for making investment decisions or preparing reports.
Why Opt for This Calculator?
- Precision: Based on authentic China Shenhua Energy financials for reliable data.
- Versatility: Allows users to experiment and adjust inputs with ease.
- Efficiency: Eliminate the need to construct a DCF model from the ground up.
- High-Quality: Built with the expertise and usability standards typical of CFOs.
- Accessible: Simple to navigate, even for those lacking extensive financial modeling skills.
Who Can Benefit from China Shenhua Energy Company Limited (1088HK)?
- Investors: Leverage an advanced valuation tool to make well-informed investment choices.
- Financial Analysts: Enhance efficiency with a customizable DCF model designed for rapid use.
- Consultants: Easily modify the template for client-focused presentations or reports.
- Energy Sector Enthusiasts: Expand your knowledge of valuation methods with practical, real-world insights.
- Educators and Students: Utilize it as an effective resource for finance and energy-focused studies.
Contents of the Template
- Pre-Filled DCF Model: Financial data for China Shenhua Energy Company Limited (1088HK) preloaded for immediate application.
- WACC Calculator: Comprehensive calculations for Weighted Average Cost of Capital.
- Financial Ratios: Assess China Shenhua's profitability, leverage, and operational efficiency.
- Editable Inputs: Adjust assumptions regarding growth, margins, and capital expenditures to suit your analysis.
- Financial Statements: Access to annual and quarterly reports for in-depth evaluation.
- Interactive Dashboard: Conveniently visualize essential valuation metrics and outcomes.
Disclaimer
All information, articles, and product details provided on this website are for general informational and educational purposes only. We do not claim any ownership over, nor do we intend to infringe upon, any trademarks, copyrights, logos, brand names, or other intellectual property mentioned or depicted on this site. Such intellectual property remains the property of its respective owners, and any references here are made solely for identification or informational purposes, without implying any affiliation, endorsement, or partnership.
We make no representations or warranties, express or implied, regarding the accuracy, completeness, or suitability of any content or products presented. Nothing on this website should be construed as legal, tax, investment, financial, medical, or other professional advice. In addition, no part of this site—including articles or product references—constitutes a solicitation, recommendation, endorsement, advertisement, or offer to buy or sell any securities, franchises, or other financial instruments, particularly in jurisdictions where such activity would be unlawful.
All content is of a general nature and may not address the specific circumstances of any individual or entity. It is not a substitute for professional advice or services. Any actions you take based on the information provided here are strictly at your own risk. You accept full responsibility for any decisions or outcomes arising from your use of this website and agree to release us from any liability in connection with your use of, or reliance upon, the content or products found herein.