
|
CGN Mining Company Limited (1164.HK) Évaluation DCF |
Entièrement Modifiable: Adapté À Vos Besoins Dans Excel Ou Sheets
Conception Professionnelle: Modèles Fiables Et Conformes Aux Normes Du Secteur
Pré-Construits Pour Une Utilisation Rapide Et Efficace
Compatible MAC/PC, entièrement débloqué
Aucune Expertise N'Est Requise; Facile À Suivre
CGN Mining Company Limited (1164.HK) Bundle
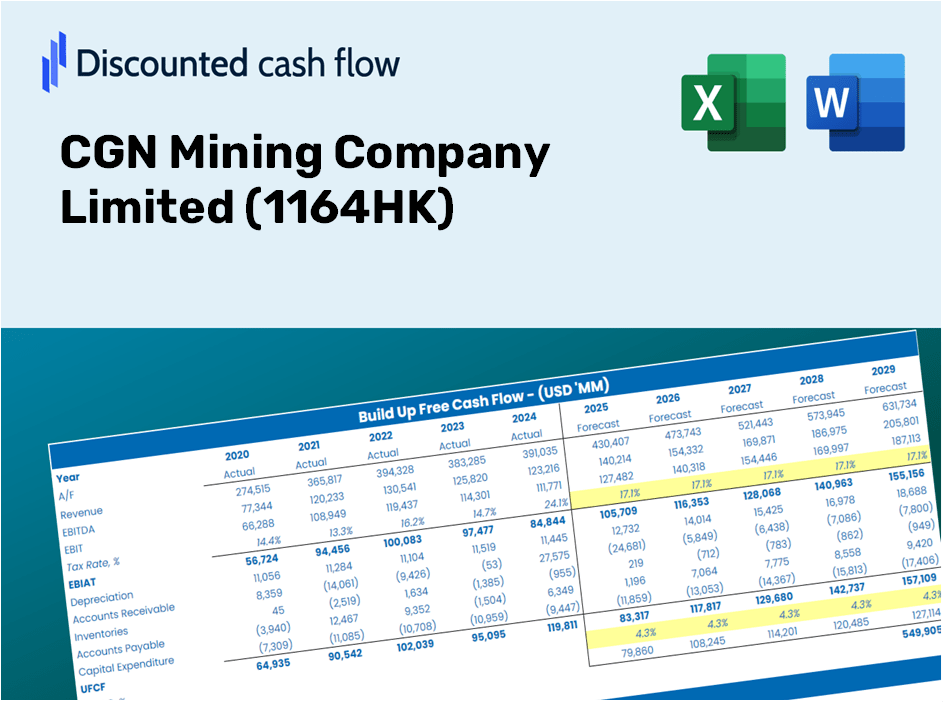
Simplifiez CGN Mining Company Limited Valuation avec cette calculatrice DCF personnalisable! Doté de Real CGN Mining Company Limited Financials et des intrants de prévision ajustés, vous pouvez tester des scénarios et découvrir la juste valeur de CGN Mining Company Limited.
Discounted Cash Flow (DCF) - (USD MM)
| Year | AY1 2020 |
AY2 2021 |
AY3 2022 |
AY4 2023 |
AY5 2024 |
FY1 2025 |
FY2 2026 |
FY3 2027 |
FY4 2028 |
FY5 2029 |
|---|---|---|---|---|---|---|---|---|---|---|
| Revenue | 2,862.2 | 3,859.5 | 3,648.7 | 7,363.1 | 8,624.3 | 11,783.1 | 16,098.9 | 21,995.5 | 30,051.8 | 41,058.9 |
| Revenue Growth, % | 0 | 34.84 | -5.46 | 101.8 | 17.13 | 36.63 | 36.63 | 36.63 | 36.63 | 36.63 |
| EBITDA | 226.4 | 108.0 | 107.3 | 692.8 | -78.4 | 522.0 | 713.2 | 974.5 | 1,331.4 | 1,819.0 |
| EBITDA, % | 7.91 | 2.8 | 2.94 | 9.41 | -0.9086 | 4.43 | 4.43 | 4.43 | 4.43 | 4.43 |
| Depreciation | 1.9 | 1.8 | 1.9 | 1.9 | 1.9 | 5.0 | 6.9 | 9.4 | 12.8 | 17.5 |
| Depreciation, % | 0.06715053 | 0.04775193 | 0.05078549 | 0.02553264 | 0.02204244 | 0.04265261 | 0.04265261 | 0.04265261 | 0.04265261 | 0.04265261 |
| EBIT | 224.5 | 106.2 | 105.5 | 690.9 | -80.3 | 517.0 | 706.4 | 965.1 | 1,318.6 | 1,801.5 |
| EBIT, % | 7.84 | 2.75 | 2.89 | 9.38 | -0.93064 | 4.39 | 4.39 | 4.39 | 4.39 | 4.39 |
| Total Cash | 1,174.5 | 81.3 | 52.4 | 1,017.2 | 1,153.8 | 1,691.4 | 2,310.9 | 3,157.3 | 4,313.7 | 5,893.6 |
| Total Cash, percent | .0 | .0 | .0 | .0 | .0 | .0 | .0 | .0 | .0 | .0 |
| Account Receivables | 354.1 | 94.6 | 345.1 | 499.5 | 80.4 | 754.0 | 1,030.2 | 1,407.6 | 1,923.1 | 2,627.5 |
| Account Receivables, % | 12.37 | 2.45 | 9.46 | 6.78 | 0.93199 | 6.4 | 6.4 | 6.4 | 6.4 | 6.4 |
| Inventories | 1,767.3 | 1,743.2 | 2,048.5 | 697.2 | 2,158.3 | 4,655.5 | 6,360.7 | 8,690.4 | 11,873.5 | 16,222.4 |
| Inventories, % | 61.75 | 45.16 | 56.14 | 9.47 | 25.03 | 39.51 | 39.51 | 39.51 | 39.51 | 39.51 |
| Accounts Payable | 147.3 | 91.8 | 655.1 | 433.7 | 766.6 | 948.8 | 1,296.4 | 1,771.2 | 2,419.9 | 3,306.2 |
| Accounts Payable, % | 5.15 | 2.38 | 17.96 | 5.89 | 8.89 | 8.05 | 8.05 | 8.05 | 8.05 | 8.05 |
| Capital Expenditure | -.5 | -.4 | -.6 | .0 | -.1 | -1.1 | -1.5 | -2.0 | -2.8 | -3.8 |
| Capital Expenditure, % | -0.01830743 | -0.01018259 | -0.01627986 | -0.000488922975 | -0.000660925351 | -0.00918394 | -0.00918394 | -0.00918394 | -0.00918394 | -0.00918394 |
| Tax Rate, % | 58 | 58 | 58 | 58 | 58 | 58 | 58 | 58 | 58 | 58 |
| EBITAT | 193.6 | 96.4 | 95.8 | 613.9 | -33.7 | 412.3 | 563.3 | 769.6 | 1,051.4 | 1,436.5 |
| Depreciation | ||||||||||
| Changes in Account Receivables | ||||||||||
| Changes in Inventories | ||||||||||
| Changes in Accounts Payable | ||||||||||
| Capital Expenditure | ||||||||||
| UFCF | -1,779.1 | 326.1 | 104.5 | 1,591.1 | -740.9 | -2,572.4 | -1,065.2 | -1,455.3 | -1,988.4 | -2,716.7 |
| WACC, % | 6.8 | 6.82 | 6.82 | 6.81 | 6.61 | 6.77 | 6.77 | 6.77 | 6.77 | 6.77 |
| PV UFCF | ||||||||||
| SUM PV UFCF | -8,027.1 | |||||||||
| Long Term Growth Rate, % | 2.00 | |||||||||
| Free cash flow (T + 1) | -2,771 | |||||||||
| Terminal Value | -58,077 | |||||||||
| Present Terminal Value | -41,853 | |||||||||
| Enterprise Value | -49,880 | |||||||||
| Net Debt | 1,767 | |||||||||
| Equity Value | -51,647 | |||||||||
| Diluted Shares Outstanding, MM | 7,601 | |||||||||
| Equity Value Per Share | -6.80 |
What You Will Receive
- Adjustable Forecast Parameters: Seamlessly modify assumptions (growth %, margins, WACC) to explore various scenarios.
- Industry-Specific Data: CGN Mining Company Limited’s financial information pre-loaded to kickstart your analysis.
- Automated DCF Results: The template computes Net Present Value (NPV) and intrinsic value automatically.
- Tailored and Professional Quality: An elegant Excel model that meets your valuation requirements.
- Designed for Analysts and Investors: Perfect for assessing projections, validating strategies, and enhancing efficiency.
Key Features
- 🔍 Real-Life CGN Mining Financials: Pre-filled historical and projected data for CGN Mining Company Limited (1164HK).
- ✏️ Fully Customizable Inputs: Modify essential parameters (yellow cells) such as WACC, growth %, and tax rates.
- 📊 Professional DCF Valuation: Integrated formulas compute CGN Mining’s intrinsic value using the Discounted Cash Flow method.
- ⚡ Instant Results: See CGN Mining’s valuation immediately after making adjustments.
- Scenario Analysis: Evaluate and compare outcomes for different financial assumptions side-by-side.
How It Functions
- Step 1: Download the Excel spreadsheet.
- Step 2: Examine the pre-filled CGN Mining Company Limited (1164HK) data (both historical and projected).
- Step 3: Modify key assumptions (highlighted in yellow) according to your analysis.
- Step 4: Observe automatic recalculations for CGN Mining Company Limited's (1164HK) intrinsic value.
- Step 5: Utilize the results for investment decisions or reporting purposes.
Why Choose This Calculator for CGN Mining Company Limited (1164HK)?
- User-Friendly Interface: Suitable for both novices and seasoned professionals.
- Customizable Inputs: Easily adjust parameters to tailor your analysis.
- Real-Time Feedback: Observe immediate changes to CGN Mining’s valuation as you tweak inputs.
- Preloaded Financial Data: Comes equipped with CGN Mining's actual financial figures for quick assessments.
- Relied Upon by Experts: Utilized by investors and analysts for sound decision-making.
Who Should Use This Product?
- Investors: Assess the fair value of CGN Mining Company Limited (1164HK) before making investment choices.
- CFOs: Utilize a professional-grade DCF model for accurate financial reporting and analysis.
- Consultants: Adapt the provided template for client valuation reports with ease.
- Entrepreneurs: Discover financial modeling techniques employed by leading mining companies.
- Educators: Use it as an educational resource to illustrate valuation methodologies.
What the Template Offers
- Pre-Filled Data: Contains CGN Mining Company Limited’s historical financial performance and predictions.
- Discounted Cash Flow Model: An editable DCF valuation model featuring automated calculations.
- Weighted Average Cost of Capital (WACC): A specific sheet for determining WACC with tailored inputs.
- Key Financial Ratios: Assess CGN Mining Company Limited's profitability, operational efficiency, and financial leverage.
- Customizable Inputs: Easily adjust revenue growth rates, profit margins, and tax rates.
- Clear Dashboard: Visual representations and summaries of essential valuation outcomes.
Disclaimer
All information, articles, and product details provided on this website are for general informational and educational purposes only. We do not claim any ownership over, nor do we intend to infringe upon, any trademarks, copyrights, logos, brand names, or other intellectual property mentioned or depicted on this site. Such intellectual property remains the property of its respective owners, and any references here are made solely for identification or informational purposes, without implying any affiliation, endorsement, or partnership.
We make no representations or warranties, express or implied, regarding the accuracy, completeness, or suitability of any content or products presented. Nothing on this website should be construed as legal, tax, investment, financial, medical, or other professional advice. In addition, no part of this site—including articles or product references—constitutes a solicitation, recommendation, endorsement, advertisement, or offer to buy or sell any securities, franchises, or other financial instruments, particularly in jurisdictions where such activity would be unlawful.
All content is of a general nature and may not address the specific circumstances of any individual or entity. It is not a substitute for professional advice or services. Any actions you take based on the information provided here are strictly at your own risk. You accept full responsibility for any decisions or outcomes arising from your use of this website and agree to release us from any liability in connection with your use of, or reliance upon, the content or products found herein.