
|
Livzon Pharmaceutical Group Inc. (1513.HK) Évaluation DCF |
Entièrement Modifiable: Adapté À Vos Besoins Dans Excel Ou Sheets
Conception Professionnelle: Modèles Fiables Et Conformes Aux Normes Du Secteur
Pré-Construits Pour Une Utilisation Rapide Et Efficace
Compatible MAC/PC, entièrement débloqué
Aucune Expertise N'Est Requise; Facile À Suivre
Livzon Pharmaceutical Group Inc. (1513.HK) Bundle
Vous cherchez à évaluer la valeur intrinsèque de Livzon Pharmaceutical Group Inc.? Notre calculatrice DCF (1513HK) intègre des données réelles avec des fonctionnalités de personnalisation complètes, vous permettant d'affiner vos prévisions et d'améliorer vos choix d'investissement.
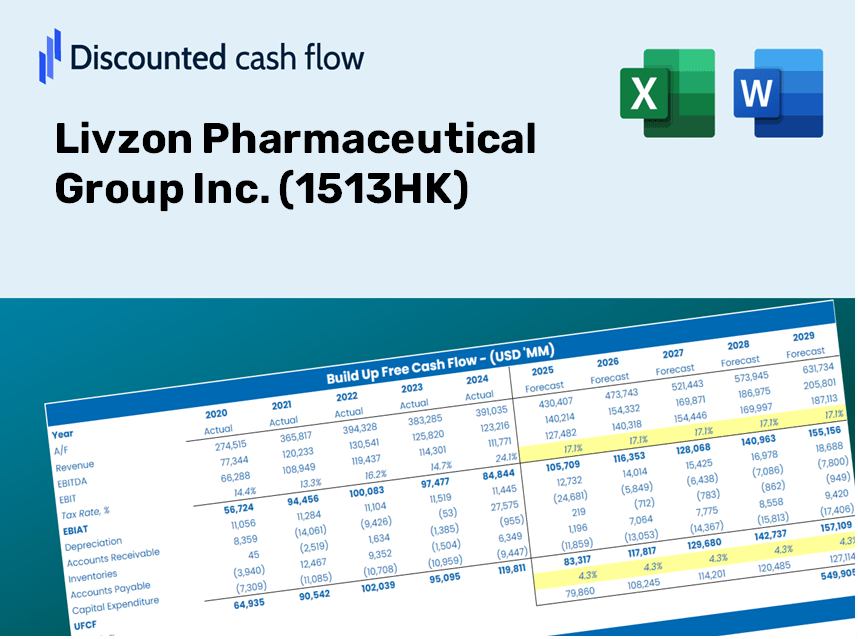
Discounted Cash Flow (DCF) - (USD MM)
| Year | AY1 2020 |
AY2 2021 |
AY3 2022 |
AY4 2023 |
AY5 2024 |
FY1 2025 |
FY2 2026 |
FY3 2027 |
FY4 2028 |
FY5 2029 |
|---|---|---|---|---|---|---|---|---|---|---|
| Revenue | 11,483.9 | 13,168.7 | 13,786.2 | 13,568.4 | 12,894.2 | 13,307.1 | 13,733.3 | 14,173.2 | 14,627.1 | 15,095.6 |
| Revenue Growth, % | 0 | 14.67 | 4.69 | -1.58 | -4.97 | 3.2 | 3.2 | 3.2 | 3.2 | 3.2 |
| EBITDA | 3,175.5 | 3,029.1 | 3,362.5 | 3,629.6 | 3,787.7 | 3,491.0 | 3,602.8 | 3,718.2 | 3,837.3 | 3,960.2 |
| EBITDA, % | 27.65 | 23 | 24.39 | 26.75 | 29.38 | 26.23 | 26.23 | 26.23 | 26.23 | 26.23 |
| Depreciation | 430.4 | 486.1 | 712.1 | 917.3 | 627.8 | 645.0 | 665.6 | 686.9 | 708.9 | 731.6 |
| Depreciation, % | 3.75 | 3.69 | 5.17 | 6.76 | 4.87 | 4.85 | 4.85 | 4.85 | 4.85 | 4.85 |
| EBIT | 2,745.1 | 2,543.0 | 2,650.5 | 2,712.3 | 3,159.9 | 2,846.0 | 2,937.2 | 3,031.3 | 3,128.3 | 3,228.5 |
| EBIT, % | 23.9 | 19.31 | 19.23 | 19.99 | 24.51 | 21.39 | 21.39 | 21.39 | 21.39 | 21.39 |
| Total Cash | 10,893.7 | 10,183.5 | 11,482.9 | 12,452.3 | 11,916.3 | 11,701.6 | 12,076.4 | 12,463.1 | 12,862.3 | 13,274.3 |
| Total Cash, percent | .0 | .0 | .0 | .0 | .0 | .0 | .0 | .0 | .0 | .0 |
| Account Receivables | 3,157.0 | 3,647.7 | 4,409.1 | 3,902.4 | 3,584.4 | 3,825.3 | 3,947.8 | 4,074.3 | 4,204.8 | 4,339.4 |
| Account Receivables, % | 27.49 | 27.7 | 31.98 | 28.76 | 27.8 | 28.75 | 28.75 | 28.75 | 28.75 | 28.75 |
| Inventories | 1,624.1 | 1,815.6 | 2,232.7 | 2,249.4 | 2,180.6 | 2,065.6 | 2,131.8 | 2,200.0 | 2,270.5 | 2,343.2 |
| Inventories, % | 14.14 | 13.79 | 16.19 | 16.58 | 16.91 | 15.52 | 15.52 | 15.52 | 15.52 | 15.52 |
| Accounts Payable | 1,773.6 | 1,983.7 | 2,032.6 | 1,810.3 | 1,729.0 | 1,916.3 | 1,977.7 | 2,041.0 | 2,106.4 | 2,173.9 |
| Accounts Payable, % | 15.44 | 15.06 | 14.74 | 13.34 | 13.41 | 14.4 | 14.4 | 14.4 | 14.4 | 14.4 |
| Capital Expenditure | -706.2 | -1,429.0 | -1,026.2 | -895.6 | -622.4 | -954.7 | -985.3 | -1,016.9 | -1,049.4 | -1,083.0 |
| Capital Expenditure, % | -6.15 | -10.85 | -7.44 | -6.6 | -4.83 | -7.17 | -7.17 | -7.17 | -7.17 | -7.17 |
| Tax Rate, % | 26.55 | 26.55 | 26.55 | 26.55 | 26.55 | 26.55 | 26.55 | 26.55 | 26.55 | 26.55 |
| EBITAT | 1,891.0 | 2,010.8 | 2,171.5 | 2,223.9 | 2,320.9 | 2,193.3 | 2,263.6 | 2,336.1 | 2,410.9 | 2,488.1 |
| Depreciation | ||||||||||
| Changes in Account Receivables | ||||||||||
| Changes in Inventories | ||||||||||
| Changes in Accounts Payable | ||||||||||
| Capital Expenditure | ||||||||||
| UFCF | -1,392.2 | 595.7 | 727.7 | 2,513.4 | 2,631.9 | 1,944.9 | 1,816.6 | 1,874.8 | 1,934.8 | 1,996.8 |
| WACC, % | 4.38 | 4.42 | 4.44 | 4.44 | 4.4 | 4.41 | 4.41 | 4.41 | 4.41 | 4.41 |
| PV UFCF | ||||||||||
| SUM PV UFCF | 8,412.4 | |||||||||
| Long Term Growth Rate, % | 2.00 | |||||||||
| Free cash flow (T + 1) | 2,037 | |||||||||
| Terminal Value | 84,349 | |||||||||
| Present Terminal Value | 67,963 | |||||||||
| Enterprise Value | 76,376 | |||||||||
| Net Debt | -7,525 | |||||||||
| Equity Value | 83,900 | |||||||||
| Diluted Shares Outstanding, MM | 920 | |||||||||
| Equity Value Per Share | 91.18 |
What You Will Receive
- Authentic Livzon Data: Comprehensive financials – including revenue and EBIT – derived from real and forecasted figures.
- Complete Customization: Modify all key parameters (yellow cells) such as WACC, growth %, and tax rates to suit your analysis.
- Instant Valuation Adjustments: Automatic recalculations to assess the effects of changes on Livzon Pharmaceutical's fair value.
- Flexible Excel Template: Designed for effortless modifications, scenario analysis, and in-depth projections.
- Efficient and Precise: Avoid the hassle of constructing models from the ground up while ensuring accuracy and adaptability.
Key Features
- Customizable Forecast Variables: Adjust essential parameters such as revenue growth, EBITDA margin, and capital expenditures.
- Instant DCF Valuation: Automatically computes intrinsic value, NPV, and other financial metrics in real-time.
- High-Precision Accuracy: Leverages Livzon Pharmaceutical Group Inc.'s real-world financial data for credible valuation results.
- Streamlined Scenario Analysis: Easily evaluate various assumptions and analyze different outcomes.
- Efficiency Booster: Avoid the hassle of developing intricate valuation models from the ground up.
How It Works
- Step 1: Download the Excel file.
- Step 2: Examine Livzon Pharmaceutical Group Inc.’s (1513HK) pre-filled financial data and projections.
- Step 3: Adjust key inputs such as revenue growth, WACC, and tax rates (highlighted cells).
- Step 4: Observe the DCF model refresh in real-time as you alter your assumptions.
- Step 5: Evaluate the outputs and leverage the findings for your investment strategies.
Why Select This Calculator for Livzon Pharmaceutical Group Inc. (1513HK)?
- User-Friendly Interface: Crafted for both novices and seasoned users.
- Customizable Inputs: Easily adjust parameters to suit your analysis needs.
- Real-Time Adjustments: Observe immediate updates to Livzon's valuation as you modify inputs.
- Pre-Configured Data: Comes with Livzon's actual financial metrics for swift evaluations.
- Endorsed by Industry Experts: Favored by investors and analysts for informed decision-making.
Who Should Use This Product?
- Pharmacy Students: Master pharmaceutical valuation techniques using real market data.
- Researchers: Integrate advanced valuation models into your academic research on pharmaceuticals.
- Investors: Evaluate your investment strategies and assess the valuation metrics for Livzon Pharmaceutical Group Inc. (1513HK).
- Market Analysts: Enhance your analysis process with a customizable DCF model tailored for pharmaceutical stocks.
- Entrepreneurs: Understand the valuation approaches utilized for large pharmaceutical companies like Livzon.
Overview of the Template Components
- Pre-Filled Data: Contains Livzon Pharmaceutical Group Inc.'s historical financial performance and projections.
- Discounted Cash Flow Model: An editable DCF valuation model with automatic calculations integrated.
- Weighted Average Cost of Capital (WACC): A dedicated worksheet for WACC calculation based on customized inputs.
- Key Financial Ratios: Assess Livzon's profitability, efficiency, and financial leverage.
- Customizable Inputs: Easily modify revenue growth, profit margins, and tax rates.
- Clear Dashboard: Visual charts and tables summarizing essential valuation outcomes.
Disclaimer
All information, articles, and product details provided on this website are for general informational and educational purposes only. We do not claim any ownership over, nor do we intend to infringe upon, any trademarks, copyrights, logos, brand names, or other intellectual property mentioned or depicted on this site. Such intellectual property remains the property of its respective owners, and any references here are made solely for identification or informational purposes, without implying any affiliation, endorsement, or partnership.
We make no representations or warranties, express or implied, regarding the accuracy, completeness, or suitability of any content or products presented. Nothing on this website should be construed as legal, tax, investment, financial, medical, or other professional advice. In addition, no part of this site—including articles or product references—constitutes a solicitation, recommendation, endorsement, advertisement, or offer to buy or sell any securities, franchises, or other financial instruments, particularly in jurisdictions where such activity would be unlawful.
All content is of a general nature and may not address the specific circumstances of any individual or entity. It is not a substitute for professional advice or services. Any actions you take based on the information provided here are strictly at your own risk. You accept full responsibility for any decisions or outcomes arising from your use of this website and agree to release us from any liability in connection with your use of, or reliance upon, the content or products found herein.