
|
Ganfeng Lithium Co., Limited (1772.HK) Évaluation DCF |
Entièrement Modifiable: Adapté À Vos Besoins Dans Excel Ou Sheets
Conception Professionnelle: Modèles Fiables Et Conformes Aux Normes Du Secteur
Pré-Construits Pour Une Utilisation Rapide Et Efficace
Compatible MAC/PC, entièrement débloqué
Aucune Expertise N'Est Requise; Facile À Suivre
Ganfeng Lithium Co., Limited (1772.HK) Bundle
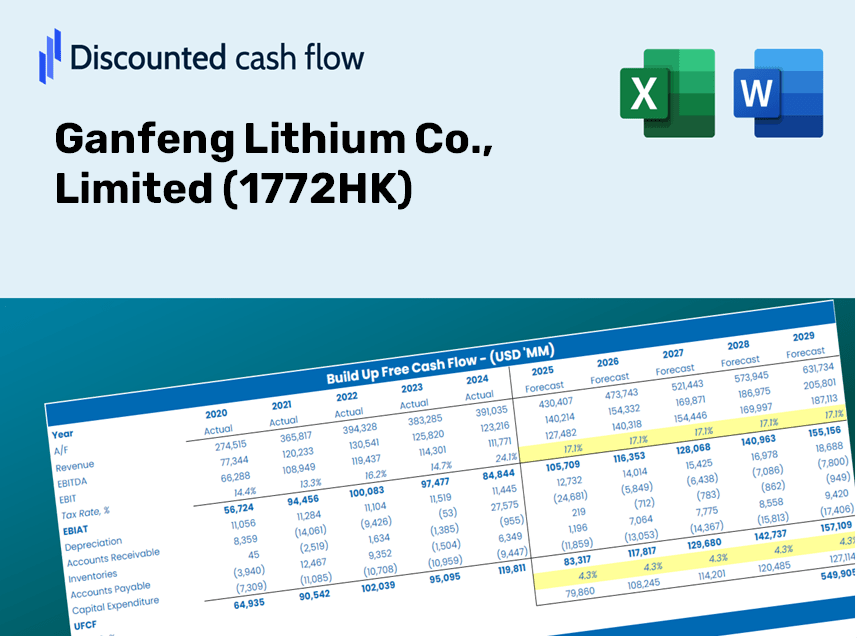
Conçu pour la précision, notre calculatrice DCF (1772HK) vous permet d'évaluer Ganfeng Lithium Co., l'évaluation de Limited en utilisant des données financières réelles, tout en offrant une flexibilité complète pour modifier tous les paramètres clés pour améliorer les prévisions.
Discounted Cash Flow (DCF) - (USD MM)
| Year | AY1 2020 |
AY2 2021 |
AY3 2022 |
AY4 2023 |
AY5 2024 |
FY1 2025 |
FY2 2026 |
FY3 2027 |
FY4 2028 |
FY5 2029 |
|---|---|---|---|---|---|---|---|---|---|---|
| Revenue | 6,053.0 | 12,231.2 | 45,827.9 | 36,129.4 | 20,717.1 | 27,770.1 | 37,224.4 | 49,897.3 | 66,884.6 | 89,655.2 |
| Revenue Growth, % | 0 | 102.07 | 274.68 | -21.16 | -42.66 | 34.04 | 34.04 | 34.04 | 34.04 | 34.04 |
| EBITDA | 1,824.4 | 7,018.4 | 25,956.9 | 7,577.8 | 78.6 | 9,192.7 | 12,322.3 | 16,517.4 | 22,140.7 | 29,678.4 |
| EBITDA, % | 30.14 | 57.38 | 56.64 | 20.97 | 0.37919 | 33.1 | 33.1 | 33.1 | 33.1 | 33.1 |
| Depreciation | 297.8 | 401.7 | 550.3 | 956.0 | 1,404.9 | 1,046.0 | 1,402.1 | 1,879.4 | 2,519.2 | 3,376.9 |
| Depreciation, % | 4.92 | 3.28 | 1.2 | 2.65 | 6.78 | 3.77 | 3.77 | 3.77 | 3.77 | 3.77 |
| EBIT | 1,526.6 | 6,616.7 | 25,406.6 | 6,621.8 | -1,326.4 | 8,146.7 | 10,920.3 | 14,638.0 | 19,621.5 | 26,301.5 |
| EBIT, % | 25.22 | 54.1 | 55.44 | 18.33 | -6.4 | 29.34 | 29.34 | 29.34 | 29.34 | 29.34 |
| Total Cash | 2,479.4 | 7,247.0 | 11,100.2 | 10,459.5 | 6,530.4 | 10,269.6 | 13,765.9 | 18,452.4 | 24,734.5 | 33,155.3 |
| Total Cash, percent | .0 | .0 | .0 | .0 | .0 | .0 | .0 | .0 | .0 | .0 |
| Account Receivables | 1,973.3 | 3,673.2 | 11,198.6 | 7,465.8 | 5,569.3 | 7,476.5 | 10,021.8 | 13,433.7 | 18,007.2 | 24,137.7 |
| Account Receivables, % | 32.6 | 30.03 | 24.44 | 20.66 | 26.88 | 26.92 | 26.92 | 26.92 | 26.92 | 26.92 |
| Inventories | 2,426.9 | 3,597.8 | 11,079.4 | 9,055.4 | 9,438.0 | 9,125.6 | 12,232.4 | 16,396.8 | 21,979.0 | 29,461.7 |
| Inventories, % | 40.09 | 29.41 | 24.18 | 25.06 | 45.56 | 32.86 | 32.86 | 32.86 | 32.86 | 32.86 |
| Accounts Payable | 1,580.4 | 3,240.5 | 10,944.3 | 5,944.0 | 13,365.2 | 8,744.8 | 11,721.9 | 15,712.6 | 21,062.0 | 28,232.4 |
| Accounts Payable, % | 26.11 | 26.49 | 23.88 | 16.45 | 64.51 | 31.49 | 31.49 | 31.49 | 31.49 | 31.49 |
| Capital Expenditure | -1,326.2 | -3,740.3 | -5,423.8 | -9,474.2 | -9,367.1 | -7,540.2 | -10,107.3 | -13,548.2 | -18,160.7 | -24,343.4 |
| Capital Expenditure, % | -21.91 | -30.58 | -11.84 | -26.22 | -45.21 | -27.15 | -27.15 | -27.15 | -27.15 | -27.15 |
| Tax Rate, % | 9.87 | 9.87 | 9.87 | 9.87 | 9.87 | 9.87 | 9.87 | 9.87 | 9.87 | 9.87 |
| EBITAT | 1,387.6 | 5,992.0 | 22,869.0 | 6,229.0 | -1,195.4 | 7,424.3 | 9,951.9 | 13,340.0 | 17,881.6 | 23,969.3 |
| Depreciation | ||||||||||
| Changes in Account Receivables | ||||||||||
| Changes in Inventories | ||||||||||
| Changes in Accounts Payable | ||||||||||
| Capital Expenditure | ||||||||||
| UFCF | -2,460.5 | 1,442.7 | 10,692.2 | -1,532.6 | -222.5 | -5,285.1 | -1,428.3 | -1,914.5 | -2,566.3 | -3,440.0 |
| WACC, % | 7.16 | 7.16 | 7.16 | 7.19 | 7.16 | 7.17 | 7.17 | 7.17 | 7.17 | 7.17 |
| PV UFCF | ||||||||||
| SUM PV UFCF | -12,110.4 | |||||||||
| Long Term Growth Rate, % | 2.00 | |||||||||
| Free cash flow (T + 1) | -3,509 | |||||||||
| Terminal Value | -67,924 | |||||||||
| Present Terminal Value | -48,056 | |||||||||
| Enterprise Value | -60,166 | |||||||||
| Net Debt | 20,606 | |||||||||
| Equity Value | -80,772 | |||||||||
| Diluted Shares Outstanding, MM | 1,995 | |||||||||
| Equity Value Per Share | -40.49 |
Benefits You Will Receive
- Adjustable Forecast Parameters: Effortlessly modify assumptions (growth %, profit margins, WACC) to generate various scenarios.
- Comprehensive Market Data: Ganfeng Lithium’s financial information pre-loaded to facilitate your analysis.
- Instant DCF Calculations: The model automatically computes Net Present Value (NPV) and intrinsic value for you.
- Customizable and Sleek Design: A refined Excel framework that caters to your valuation requirements.
- Designed for Analysts and Investors: Perfect for evaluating projections, verifying strategies, and enhancing efficiency.
Key Features
- 🔍 Real-Life Ganfeng Lithium Financials: Pre-filled historical and projected data for Ganfeng Lithium Co., Limited (1772HK).
- ✏️ Fully Customizable Inputs: Adjust all critical parameters (yellow cells) such as WACC, growth percentage, and tax rates.
- 📊 Professional DCF Valuation: Built-in formulas determine Ganfeng Lithium’s intrinsic value using the Discounted Cash Flow methodology.
- ⚡ Instant Results: Visualize Ganfeng Lithium’s valuation immediately upon making adjustments.
- Scenario Analysis: Evaluate and compare results for various financial assumptions side-by-side.
How It Works
- 1. Access the Template: Download and open the Excel template containing Ganfeng Lithium's (1772HK) preloaded data.
- 2. Adjust Assumptions: Modify key parameters such as growth rates, WACC, and capital expenditures.
- 3. Instantly View Results: The DCF model automatically calculates the intrinsic value and NPV based on your adjustments.
- 4. Experiment with Scenarios: Analyze various forecasts to evaluate different valuation scenarios.
- 5. Present with Assurance: Share well-founded valuation insights to bolster your decision-making.
Why Opt for This Calculator?
- Designed for Experts: A sophisticated tool trusted by analysts, CFOs, and industry consultants.
- Comprehensive Data: Ganfeng Lithium’s historical and projected financials are preloaded for precision.
- Forecast Scenarios: Effortlessly simulate various forecasts and assumptions.
- Clear Results: Instantly calculates intrinsic value, NPV, and other essential metrics.
- User-Friendly: Step-by-step guidance helps you navigate the calculations easily.
Who Can Benefit from Ganfeng Lithium Co., Limited (1772HK)?
- Investors: Make informed investment choices using our comprehensive analysis tools.
- Financial Analysts: Streamline your work with our customizable DCF model designed for efficiency.
- Consultants: Easily tailor templates for impactful client presentations or detailed reports.
- Finance Enthusiasts: Enhance your knowledge of lithium market valuations through practical case studies.
- Educators and Students: Utilize our resources as effective teaching aids in finance-related courses.
Contents of the Template
- In-Depth DCF Model: Editable template featuring extensive valuation computations.
- Real-World Data: Ganfeng Lithium’s historical and projected financial figures pre-loaded for analysis.
- Customizable Parameters: Modify WACC, growth rates, and tax assumptions to explore different scenarios.
- Financial Statements: Comprehensive annual and quarterly breakdowns for enhanced insights.
- Key Ratios: Integrated analysis for profitability, efficiency, and leverage metrics.
- Dashboard with Visual Outputs: Charts and tables designed for clear and actionable insights.
Disclaimer
All information, articles, and product details provided on this website are for general informational and educational purposes only. We do not claim any ownership over, nor do we intend to infringe upon, any trademarks, copyrights, logos, brand names, or other intellectual property mentioned or depicted on this site. Such intellectual property remains the property of its respective owners, and any references here are made solely for identification or informational purposes, without implying any affiliation, endorsement, or partnership.
We make no representations or warranties, express or implied, regarding the accuracy, completeness, or suitability of any content or products presented. Nothing on this website should be construed as legal, tax, investment, financial, medical, or other professional advice. In addition, no part of this site—including articles or product references—constitutes a solicitation, recommendation, endorsement, advertisement, or offer to buy or sell any securities, franchises, or other financial instruments, particularly in jurisdictions where such activity would be unlawful.
All content is of a general nature and may not address the specific circumstances of any individual or entity. It is not a substitute for professional advice or services. Any actions you take based on the information provided here are strictly at your own risk. You accept full responsibility for any decisions or outcomes arising from your use of this website and agree to release us from any liability in connection with your use of, or reliance upon, the content or products found herein.