
|
Stella International Holdings Limited (1836.hk) Valation DCF |
Entièrement Modifiable: Adapté À Vos Besoins Dans Excel Ou Sheets
Conception Professionnelle: Modèles Fiables Et Conformes Aux Normes Du Secteur
Pré-Construits Pour Une Utilisation Rapide Et Efficace
Compatible MAC/PC, entièrement débloqué
Aucune Expertise N'Est Requise; Facile À Suivre
Stella International Holdings Limited (1836.HK) Bundle
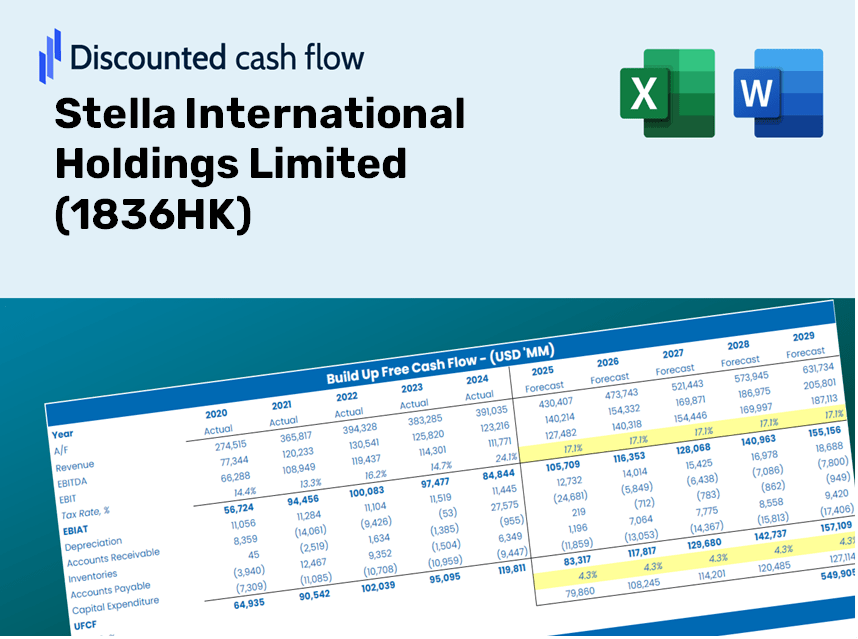
Gagnez la maîtrise sur votre analyse d'évaluation de votre Stella International Holdings Limited (1836HK) à l'aide de notre calculatrice sophistiquée DCF! Avec des données réelles préchargées (1836HK), ce modèle Excel vous permet d'ajuster les prévisions et les hypothèses, permettant des calculs précis de la valeur intrinsèque de Stella International Holdings Limited.
Discounted Cash Flow (DCF) - (USD MM)
| Year | AY1 2020 |
AY2 2021 |
AY3 2022 |
AY4 2023 |
AY5 2024 |
FY1 2025 |
FY2 2026 |
FY3 2027 |
FY4 2028 |
FY5 2029 |
|---|---|---|---|---|---|---|---|---|---|---|
| Revenue | 8,841.6 | 11,992.0 | 12,693.8 | 11,618.7 | 12,027.0 | 13,125.4 | 14,324.0 | 15,632.1 | 17,059.7 | 18,617.6 |
| Revenue Growth, % | 0 | 35.63 | 5.85 | -8.47 | 3.51 | 9.13 | 9.13 | 9.13 | 9.13 | 9.13 |
| EBITDA | 421.4 | 1,250.2 | 1,499.3 | 1,700.7 | 1,712.6 | 1,466.9 | 1,600.9 | 1,747.1 | 1,906.6 | 2,080.7 |
| EBITDA, % | 4.77 | 10.43 | 11.81 | 14.64 | 14.24 | 11.18 | 11.18 | 11.18 | 11.18 | 11.18 |
| Depreciation | 341.2 | 382.9 | 359.0 | 437.6 | 378.8 | 440.9 | 481.2 | 525.1 | 573.1 | 625.4 |
| Depreciation, % | 3.86 | 3.19 | 2.83 | 3.77 | 3.15 | 3.36 | 3.36 | 3.36 | 3.36 | 3.36 |
| EBIT | 80.2 | 867.3 | 1,140.3 | 1,263.2 | 1,333.8 | 1,026.0 | 1,119.7 | 1,221.9 | 1,333.5 | 1,455.3 |
| EBIT, % | 0.90723 | 7.23 | 8.98 | 10.87 | 11.09 | 7.82 | 7.82 | 7.82 | 7.82 | 7.82 |
| Total Cash | 850.9 | 1,056.2 | 1,663.0 | 2,292.2 | 3,296.9 | 2,065.2 | 2,253.8 | 2,459.6 | 2,684.3 | 2,929.4 |
| Total Cash, percent | .0 | .0 | .0 | .0 | .0 | .0 | .0 | .0 | .0 | .0 |
| Account Receivables | 2,065.1 | 2,557.4 | 2,059.1 | 2,162.5 | 2,073.2 | 2,539.9 | 2,771.8 | 3,024.9 | 3,301.2 | 3,602.7 |
| Account Receivables, % | 23.36 | 21.33 | 16.22 | 18.61 | 17.24 | 19.35 | 19.35 | 19.35 | 19.35 | 19.35 |
| Inventories | 1,440.0 | 1,760.6 | 1,469.2 | 1,534.4 | 1,582.8 | 1,808.9 | 1,974.1 | 2,154.4 | 2,351.2 | 2,565.9 |
| Inventories, % | 16.29 | 14.68 | 11.57 | 13.21 | 13.16 | 13.78 | 13.78 | 13.78 | 13.78 | 13.78 |
| Accounts Payable | 601.5 | 689.8 | 517.3 | 644.2 | 740.3 | 743.7 | 811.6 | 885.7 | 966.6 | 1,054.9 |
| Accounts Payable, % | 6.8 | 5.75 | 4.08 | 5.54 | 6.16 | 5.67 | 5.67 | 5.67 | 5.67 | 5.67 |
| Capital Expenditure | -397.7 | -433.6 | -450.9 | -526.5 | -521.4 | -539.0 | -588.2 | -641.9 | -700.6 | -764.5 |
| Capital Expenditure, % | -4.5 | -3.62 | -3.55 | -4.53 | -4.33 | -4.11 | -4.11 | -4.11 | -4.11 | -4.11 |
| Tax Rate, % | 13.97 | 13.97 | 13.97 | 13.97 | 13.97 | 13.97 | 13.97 | 13.97 | 13.97 | 13.97 |
| EBITAT | 60.7 | 751.7 | 1,010.5 | 1,104.5 | 1,147.5 | 870.8 | 950.4 | 1,037.2 | 1,131.9 | 1,235.2 |
| Depreciation | ||||||||||
| Changes in Account Receivables | ||||||||||
| Changes in Inventories | ||||||||||
| Changes in Accounts Payable | ||||||||||
| Capital Expenditure | ||||||||||
| UFCF | -2,899.4 | -23.5 | 1,535.7 | 973.8 | 1,141.9 | 83.4 | 514.1 | 561.0 | 612.3 | 668.2 |
| WACC, % | 4.57 | 4.58 | 4.58 | 4.58 | 4.58 | 4.58 | 4.58 | 4.58 | 4.58 | 4.58 |
| PV UFCF | ||||||||||
| SUM PV UFCF | 2,086.6 | |||||||||
| Long Term Growth Rate, % | 0.50 | |||||||||
| Free cash flow (T + 1) | 672 | |||||||||
| Terminal Value | 16,474 | |||||||||
| Present Terminal Value | 13,171 | |||||||||
| Enterprise Value | 15,258 | |||||||||
| Net Debt | -3,203 | |||||||||
| Equity Value | 18,462 | |||||||||
| Diluted Shares Outstanding, MM | 827 | |||||||||
| Equity Value Per Share | 22.33 |
Benefits You Will Receive
- Comprehensive Financial Model: Utilizes Stella International's actual data for accurate DCF valuation.
- Complete Forecasting Control: Modify revenue growth, profit margins, WACC, and other essential parameters.
- Real-Time Calculations: Automatic updates allow you to see the effects of your adjustments instantly.
- Professional-Grade Template: An advanced Excel file crafted for top-tier valuation processes.
- Flexible and Reusable: Designed for adaptability, enabling repeated application for in-depth forecasts.
Key Features
- Accurate Financial Data for Stella International: Gain access to reliable pre-loaded historical figures and future forecasts.
- Customizable Forecast Inputs: Modify yellow-highlighted fields such as WACC, growth rates, and margins according to your needs.
- Real-time Calculations: Automatic updates for DCF, Net Present Value (NPV), and cash flow assessments.
- User-Friendly Dashboard: Clear charts and summaries designed to help you easily interpret your valuation outcomes.
- Ideal for All Users: A straightforward, intuitive layout tailored for investors, CFOs, and consultants alike.
How It Operates
- Step 1: Download the Excel file.
- Step 2: Examine the pre-filled data for Stella International Holdings Limited (1836HK) covering both historical and forecasted figures.
- Step 3: Modify key assumptions (highlighted in yellow) according to your analysis.
- Step 4: Observe the automatic recalculations of the intrinsic value for Stella International Holdings Limited (1836HK).
- Step 5: Utilize the results for making investment choices or generating reports.
Why Opt for This Calculator?
- Reliable Data: Access genuine financial information for Stella International Holdings Limited (1836HK) to ensure dependable valuation outcomes.
- Tailorable: Modify essential parameters such as growth rates, WACC, and tax rates to align with your forecasts.
- Efficiency Boost: Ready-to-use calculations save you the hassle of starting from square one.
- Expert-Level Tool: Crafted for the needs of investors, analysts, and consultants alike.
- Easy to Navigate: A user-friendly design and detailed step-by-step guidance make it accessible for everyone.
Who Should Use This Product?
- Individual Investors: Make informed decisions regarding the buying or selling of Stella International Holdings Limited (1836HK) stock.
- Financial Analysts: Enhance valuation processes with readily available financial models tailored for Stella International Holdings Limited (1836HK).
- Consultants: Provide clients with accurate and prompt valuation insights related to Stella International Holdings Limited (1836HK).
- Business Owners: Gain a deeper understanding of how companies like Stella International Holdings Limited (1836HK) are valued to inform your own business strategy.
- Finance Students: Acquire practical knowledge of valuation techniques using real-world data and scenarios from Stella International Holdings Limited (1836HK).
Contents of the Template
- Historical Data: Contains past financial performance and baseline forecasts for Stella International Holdings Limited (1836HK).
- DCF and Levered DCF Models: Comprehensive templates designed to calculate the intrinsic value of Stella International Holdings Limited (1836HK).
- WACC Sheet: Built-in calculations for the Weighted Average Cost of Capital.
- Editable Inputs: Adjust key variables such as growth rates, EBITDA %, and CAPEX assumptions.
- Quarterly and Annual Statements: An extensive breakdown of financials for Stella International Holdings Limited (1836HK).
- Interactive Dashboard: Dynamically visualize valuation results and future projections.
Disclaimer
All information, articles, and product details provided on this website are for general informational and educational purposes only. We do not claim any ownership over, nor do we intend to infringe upon, any trademarks, copyrights, logos, brand names, or other intellectual property mentioned or depicted on this site. Such intellectual property remains the property of its respective owners, and any references here are made solely for identification or informational purposes, without implying any affiliation, endorsement, or partnership.
We make no representations or warranties, express or implied, regarding the accuracy, completeness, or suitability of any content or products presented. Nothing on this website should be construed as legal, tax, investment, financial, medical, or other professional advice. In addition, no part of this site—including articles or product references—constitutes a solicitation, recommendation, endorsement, advertisement, or offer to buy or sell any securities, franchises, or other financial instruments, particularly in jurisdictions where such activity would be unlawful.
All content is of a general nature and may not address the specific circumstances of any individual or entity. It is not a substitute for professional advice or services. Any actions you take based on the information provided here are strictly at your own risk. You accept full responsibility for any decisions or outcomes arising from your use of this website and agree to release us from any liability in connection with your use of, or reliance upon, the content or products found herein.